This is the last blog in a series about the developments in the US marketplace and who have been responsible for the growth of US shrimp imports.
In this blog I will elaborate on the top 10 (15 in the case of India) exporters from the US’s largest shrimp suppliers that have been responsible for much of the growth of US imports. A big thank you once again to Angel Rubio, senior analyst at Urner Barry Consulting, who provided me with most of the data for this blog from Urner Barry’s Foreign Trade Database. I encourage all of you who want to delve deeper into the US shrimp imports to subscribe to this database or to contact Urner Barry Consulting. I will include in this blog some of the latest data from Ecuador, India, Vietnam, and Indonesia, to show you what we can expect in terms of global shrimp supplies in Q2 2022.
The Shrimp Blog is supported by: Inve Aquaculture, Benchmark Shrimp Genetics, Shrimp Improvement Systems, SPF Shrimp Feeds, Megasupply, DSM Animal Nutrition, Taprobane Seafood and Verwijs Import, Zeigler Nutrition, and Grobest.

Disclaimer: The data presented in this blog is sourced from Urner Barry’s Foreign Trade Database. The data is organized by Urner Barry Consulting and Shrimp Insights on a best-efforts basis. A considerable portion of shrimp imported into the US is declared as “order”. This volume cannot be linked to a specific importer or exporter and therefore the numbers may differ slightly from the actual numbers. Nevertheless, we are certain that these numbers provide a good insight into the exporters that lead the US shrimp supplies.

India
In terms of its overall shrimp exports, India had a good year in 2021. The country exported 714,000 MT, up by 24% compared to 2020. In 2021, with 347,000 MT, India’s dependence on the US in terms of its overall shrimp exports accounted for 49%. In terms of its L. vannamei exports alone this might have even been around 60%, considering that India also exports around 50,000-100,000 MT of wild-caught shrimp and P. monodon shrimp that’s primarily targeted to the EU, Middle East and Asian markets.
Making a list of India’s top 10 exporters to the US based on Urner Barry’s Foreign Trade Database is a bit tricky. The fact that more than 60,000 MT of the shrimp exported to the US is declared with customs unanimously makes that such a top of 10 wouldn’t be very reliable. To avoid us overlooking any of the major Indian exporters to the US, Figure 2 therefore presents the top 15 Indian exporters instead.
Figure 1: India’s top 15 exporters to the US market in 2021
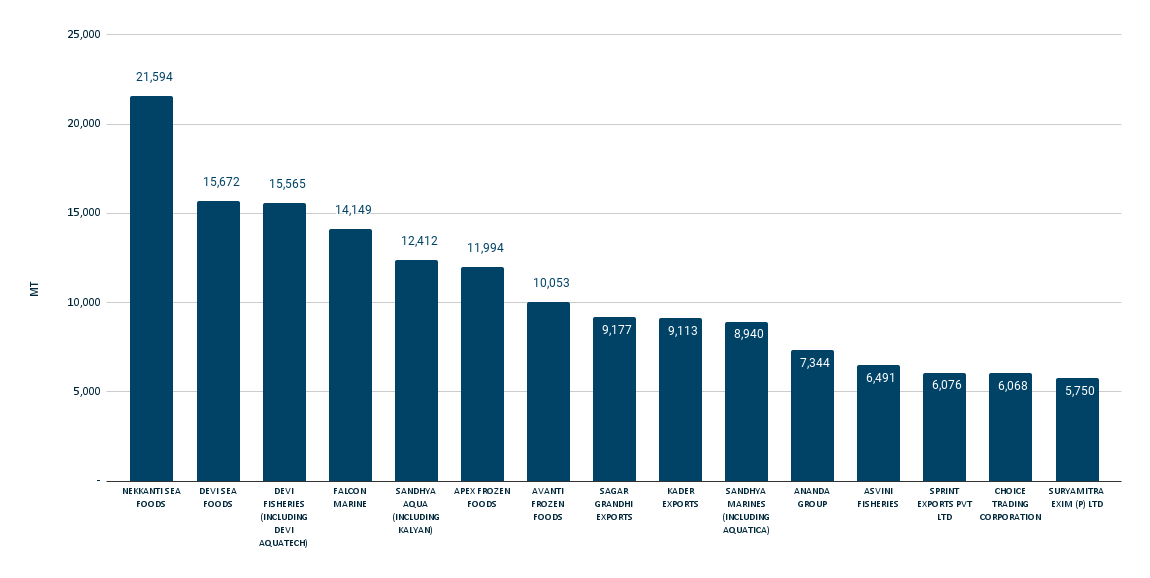
Source: Urner Barry Consulting and Shrimp Insights using Urner Barry’s Foreign Trade Data (www.foreigntradedata.com)
So within these top 15 exporters to the US there’s uncertainty about the actual export volumes. Some industry insiders for example claim that the volumes of Sandhya Aqua and Sandhya Marines are considerably higher, each possibly totaling around 15,000 MT. Others claim that Asvini Fisheries also exports much more shrimp to the US than Urner Barry’s Trade Data tells us. Unfortunately, there’s no way to verify these claims.
In terms of India’s overall largest exporters, the fact that at least 40% of Indian L. vannamei shrimp is not exported to the US but to China, Japan, the EU, and other markets around the world makes that some major Indian exports might be missing from Figure 2. This includes companies such as Growel, Forstar, and CP Foods, which are targeted more towards Chinese and/or Japanese markets. Truly understanding India’s processing and export landscape requires a deeper dive into the market and a lot of conversations with industry insiders going way beyond the scope of this blog.

Indonesia
In terms of its overall shrimp exports, Indonesia is dependent on the US market for 79%. If we were to look at L. vannamei alone, this dependency would be even higher as other species are primarily exported to Japan and other regional markets. I wouldn’t be surprised if 85-90% of Indonesia’s L. vannamei exports ends up in the US market.
We can get a pretty reliable picture of Indonesia’s total L. vannamei exports from Figure 4, displaying Indonesia’s largest exporters to the US market. Contrary to India, the amount of shrimp from Indonesia declared anonymously is limited, so also from that perspective Figure 4 is a reliable representation of the size of Indonesia’s main shrimp exporters.
Figure 2: Indonesia’s top 10 exporters to the US market in 2021
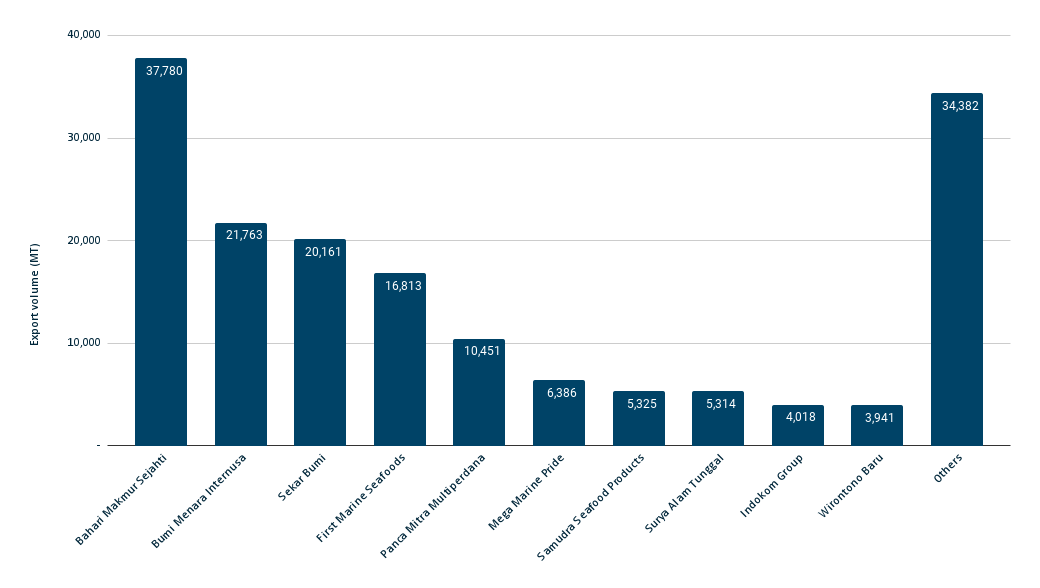
Source: Urner Barry Consulting and Shrimp Insights using Urner Barry’s Foreign Trade Data (www.foreigntradedata.com)
Looking at the total volume that these top exporters represent, it’s clear that there’s a large degree of consolidation in Indonesia’s exports to the US. The top 10 players represent 80% of total exports to the US, significantly higher than the shares of the top 10 exporters in Ecuador (55%), India (48-65%), and Vietnam (49%).
One additional observation is that CP Prima, which was once Indonesia’s largest exporter by far, is not a significant player anymore. Reportedly, the company exports around 6,500 MT primarily targeted to the EU and Asian markets. Due to this market focus, CP Prima is absent from Figure 4 but most likely should deserve a spot in Indonesia’s top 10 exporters.

Ecuador
Ecuador’s exports have performed exceptionally well and just like India the country seems to be on track to drastically increase its output in 2022. From 2020 to 2021, Ecuador increased its output by 24% to 842,000 MT. Looking at its exports in January and February 2022 – combined totaling 155,000 MT, an increase of 49% compared to the same period in 2021 – we can be quite certain that Ecuador is heading for new heights this year.
For Ecuador’s exporters a major challenge is to make the investments needed to produce peeled and further value-added products to be able to penetrate markets which it previously was not prioritizing. This requires either investments in infrastructure and workforce as shrimp peeling requires space and is a time-consuming activity, or investments in peeling machines, which are increasingly competitive with manual labor due to the rising labor costs on one hand and the higher efficiency of the machines on the other.
Figure 3: Ecuador’s top 10 exporters to the US market in 2021
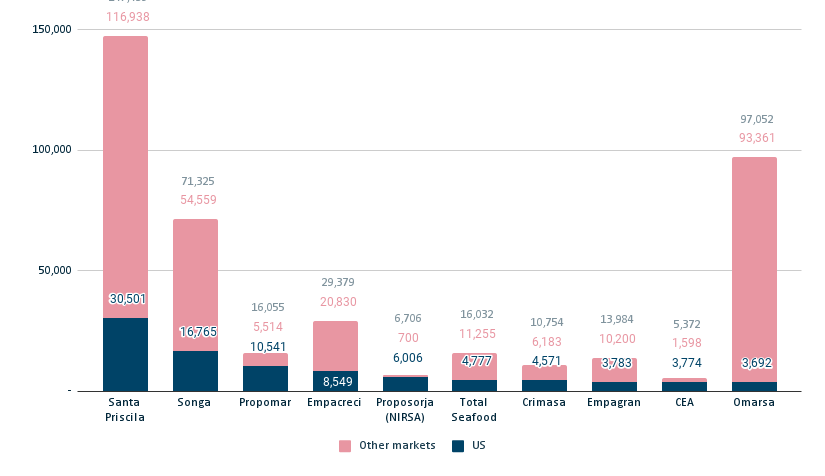
Source: Urner Barry Consulting and Shrimp Insights using Urner Barry’s Foreign Trade Data (www.foreigntradedata.com), and Camera Nacional de Acuicultura (www.cna-ecuador.com)
Looking at the companies that are responsible for the largest part of Ecuador’s exports to the US (Figure 5), the top 10 exporters are a good indication of which companies are making these investments. In terms of consolidation, the top 10 exporters to the US account for 55% of Ecuador’s total exports to the US. Looking at the total export volume, Ecuador’s top 10 exporters are responsible for around 62% of exports.

There are big differences in how much of the exports of these companies goes to the US market. In 2021, Propomar, Proposorja, and CEA depend for 65-85% of their total exports on the US market. Ecuador’s top 3 exporters Santa Priscila, Omarsa, and Songa depend on the US for only about 20%, 24%, and 4% respectively.
Despite the low dependency on the US market today, it’s very likely that with the growth of Ecuador’s production volume, exporters will invest more in their value-added processing capacities and in further penetrating into the US and other value-added markets.

Vietnam
In 2021, Vietnam’s shrimp exports to the US reached a value of $1bn. According to VASEP, 90% of exports consisted of L. vannamei, 8% of P. monodon, and the remainder of wild-caught shrimp. In terms of export volume to the US, Vietnam exported around 88,000 MT of shrimp to the US market in 2021 (NOAA). It’s for the first time since 2014 that Vietnam set a new US export record. In 2014, exports reached 73,000 MT, which then dropped to a low of 43,000 MT in 2019, before starting to increase again by respectively 57% from 2019 to 2020, and 33% from 2020 to 2021. While exports of value-added shrimp increased by 63% from 2019 to 2020 and today account for 58% of total exports, exports of raw frozen HLSO, HOSO and peeled shrimp increased by 310% over the same period and today account for 42% of total exports to the US. This trend is most likely linked to the relaxation of US anti-dumping duties for Vietnam’s shrimp exporters and the efforts exporters have been making to regain market share.
Figure 4: Vietnam’s top 10 exporters to the US market in 2021
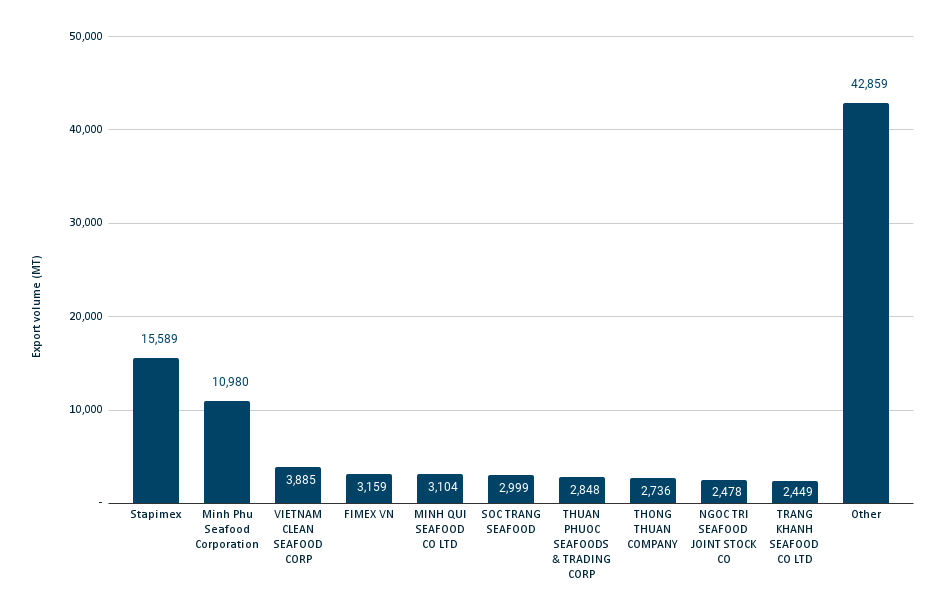
Source: Urner Barry Consulting and Shrimp Insights using Urner Barry’s Foreign Trade Data (www.foreigntradedata.com)
The top 10 exporters from Vietnam to the US is, surprisingly, not headed by Minh Phu but by Stapimex, overall Vietnam’s second largest exporter. Minh Phu follows in second place but the company is clearly – both in absolute as well as in relative terms – much less dependent on the US market than Stapimex. Combined, the top 10 Vietnamese exporters account for around 52% of the US’s total imports from Vietnam.

Next Blog on India
After a series of reports on the US marketplace, the next Shrimp Insights blog will turn towards India, in which I’ll be sharing a review and outlook of India’s shrimp production and exports.