This blog will take you through shrimp export data of the first three quarters of 2023 from the world’s six largest exporters: Ecuador, India, Indonesia, Vietnam, Thailand, and China. In Q3, the average prices of exported shrimp remained low. During this price slump, export volumes from some origins continued to grow while others dropped (Figure 1). Combined exports from these top six exporters in Q1-Q3 2023 grew slightly, increasing from 1.65m MT in 2021 to 1.85m MT in 2022 to 1.87m MT in 2023. At the end of this blog you’ll find my thoughts about the main developments to keep in mind while looking ahead to the remainder of 2023 and into 2024. I’ll also discuss the new anti-dumping duty petitions that have been filed in the US.
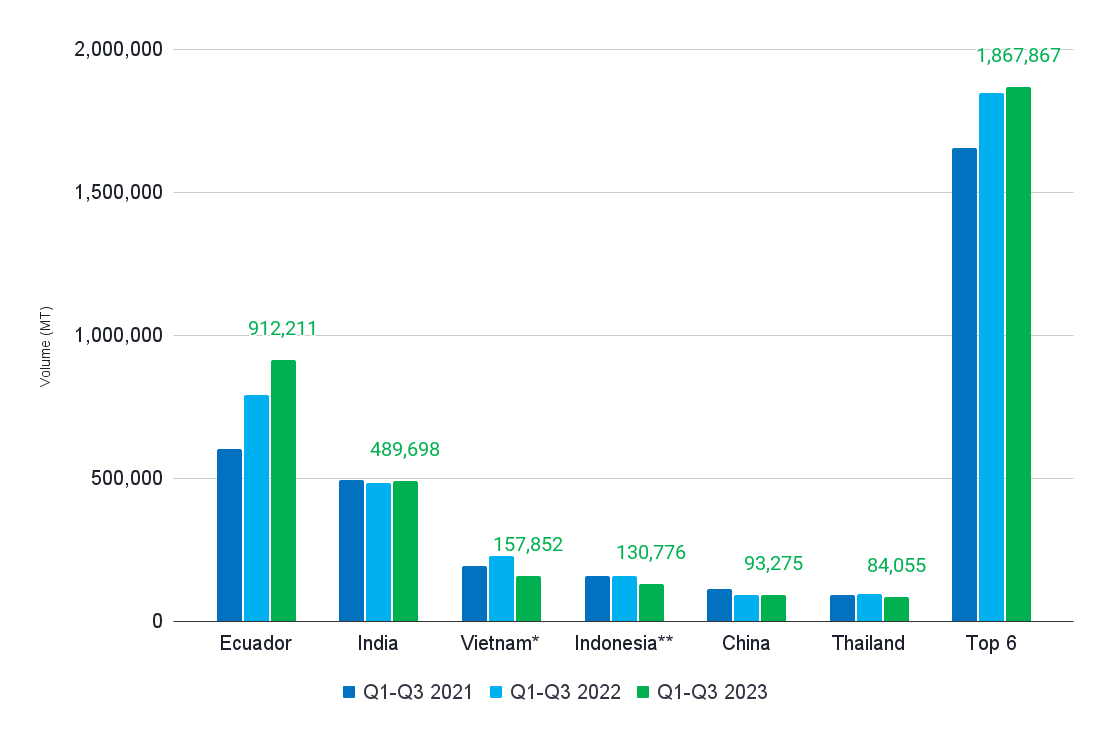
Source: CNA Ecuador; Ministry of Commerce India; ITC Trademap; Ministry of Marine Affairs and Fisheries Indonesia
* Vietnam data consists of up-to-date mirror data from the EU-27, the US, Japan, South Korea, and the UK
** Indonesia data consists of KKP data of the volume of L. vannamei tested for exports
In 2023, the Shrimp Blog is supported by: Inve Aquaculture, Taprobane Seafoods, DSM Animal Nutrition, Zeigler Nutrition, aquaconnect, Bioiberica, Megasupply, American Penaeid, and Omarsa.

Ecuador
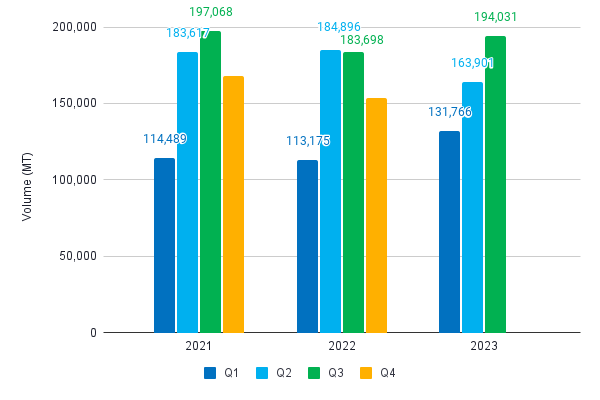
Although some people expected Ecuador’s exports to slow down in Q3, they didn’t. Exports reached 306,162 MT, up 9% year-on-year. While they still grew over the past couple of quarters, the growth rate did slow down a bit. If we look at individual months, the third quarter started with a 3% year-on-year decline. But then exports grew by 18% and 13% in August and September, respectively. September showed an export volume of 107,361 MT, the second-highest monthly volume ever recorded, just below 109,309 MT in June 2023. In October 2023, exports reached 98,106 MT, up by 5% year-on-year. As a result, the year-total has now already surpassed 1m MT.
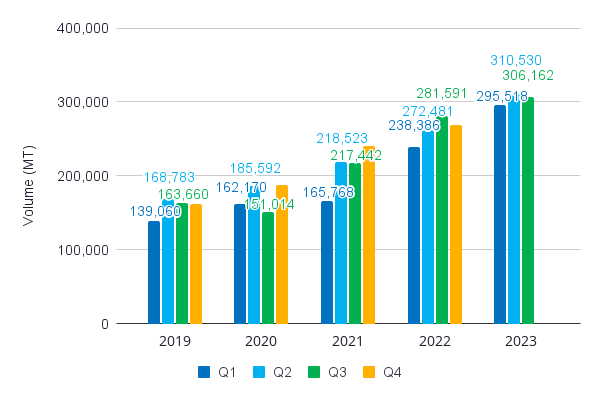
Source: CNA Ecuador
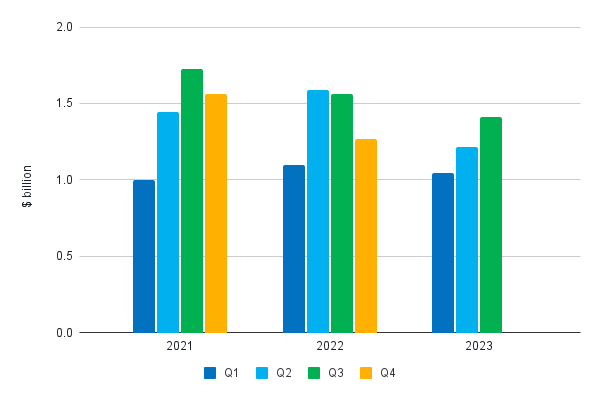
While Ecuador’s export volume still grows, the export value this year shows a negative trend. We saw earlier dips in export value in Q3 2020 during COVID-19 and in Q4 2022 when the current negative price spiral started. Although the total export volume in Q1 was still up by 5% year-on-year, in the next two quarters the total export value decreased by 5% and 15%, respectively. This reflects the negative price trend that Ecuador’s exporters have been experiencing in China and other markets they supply to. In October, the export value was $495m. The year-total has now reached $5.3bn, down by 6% year-on-year.
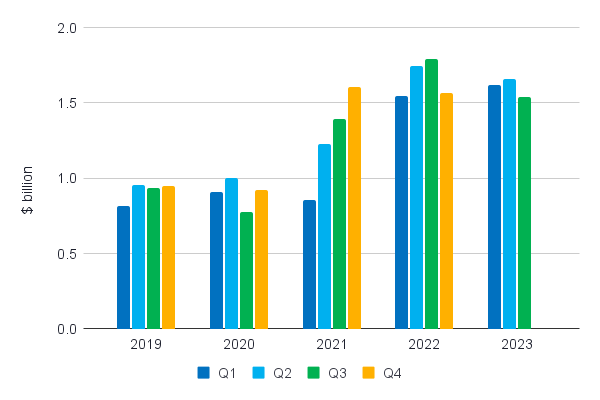
Source: CNA Ecuador
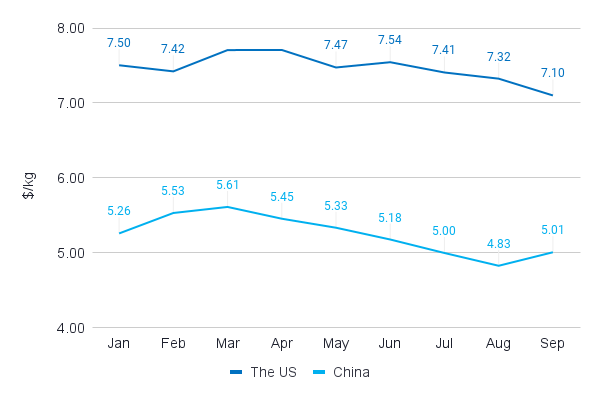
Average export prices per kg show that after prices in Q1 seemed to stabilize, they continued to drop during Q2 and the first two months of Q3. Prices then increased slightly in September, but dropped again in October. The average price per kg trends for China and the US are shown in Figure 4. We’ll have to wait and see whether the bottom has been reached yet.
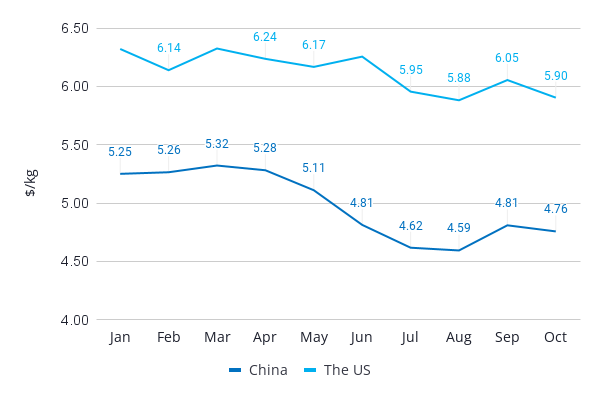
Source: CNA Ecuador
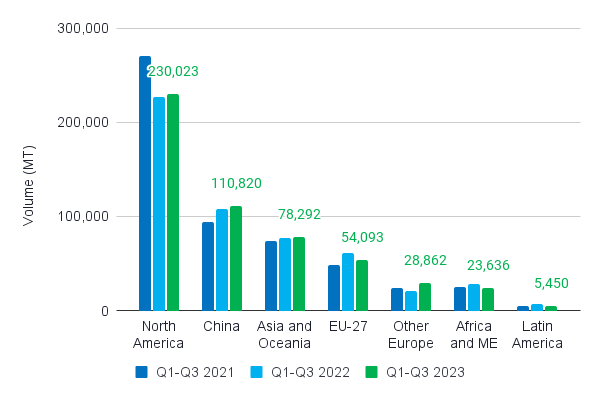
In terms of export destinations, China continues to absorb most of Ecuador’s growth. According to CNA Ecuador, in the first three quarters of 2023 exports to China grew year-on-year by 26% in volume and only 2% in value. Regarding year-on-year growth in other market blocks during the same period, CNA Ecuador states that:
- Exports to the US grew by 4% while value declined by 11%.
- Exports to Europe grew by 9% while value declined by 8%.
- Exports to other Asian markets declined by 32% while value declined by 42%.
- Exports to other Americas grew by 17% while value declined by 5%.
- Exports to Africa stayed the same while value declined by 15%.
Looking at a regional level, in the first three quarters of 2023 exports to all other markets stabilized or even declined. Within the regions there are, of course, some exceptions. In the Americas, for example, Brazil imported significantly more Ecuadorian shrimp this year (535%), but it remains only a minor player and the seventh largest market in the Americas. Russia (41%) and Belgium (114%) show positive growth within the European market.

India
With a 2% increase, India’s export volume in the first three quarters of 2023 outperformed 2022 exports. This year’s exports are even only 1% less than those in 2021, India’s record year. Looking more closely at what happened in each quarter, we see that exports in Q1 were up by 16% year-on-year. In Q2, exports dropped by 11% and increased again by 6% in Q3. July’s export volume fell 14% behind that of 2022, and we saw export volumes increase by 17% in August and by 19% in September. In those last two months, export volumes even outperformed exports in the same months in 2021, resulting in only a modest gap in export volumes between Q3 2021 and Q3 2023.
Going a bit more into detail, let’s break down India’s exports into the main product categories:
- Raw L. vannamei (HS03061720):
- Q1 exports were up by 20% YoY.
- Q2 exports decreased by 12% YoY.
- Q3 exports increased by 5% YoY.
- Year-total exports are up by 2%.
- Raw L. vannamei accounts for 86% of India’s total exports in 2023. This is similar to 2022, but down from 90% in 2021.
- Raw P. monodon (HS03061740):
- Q1 exports were up by 161% YoY.
- Q2 exports decreased by 115% YoY.
- Q3 exports increased by 55% YoY.
- Year-total exports are up by 91%.
- Raw P. monodon accounts for 5% of India’s total exports in 2023. This is up from 2% in 2022 and 1% in 2021.
- Value-added L. vannamei and P. monodon (HS160521/29):
- Q1 exports were down by 17% Y-on-Y.
- Q2 exports decreased by 14% Y-on-Y.
- Q3 exports are down by 3% Y-on-Y.
- Year-total exports are down by 18%.
- Value-added exports account for 9% of India’s total exports in 2023. This is down from 11% in 2022 and up from 8% in 2021.
Source: Ministry of Commerce, India
Just like Ecuador, India’s export value is on the decline. While export volumes haven’t dropped yet, the year-total export value in Q1-Q3 dropped to $3.7bn, a 13% year-on-year decline. Looking at each quarter, export value was down by 14% in Q1, by 23% in Q2 and by 10% in Q3. This reflects the negative price trend that exporters have experienced in the US and China, India’s two largest export markets.
Source: Ministry of Commerce, India
Average export prices per kg for Indian shrimp to the US and China roughly followed the same trend as for Ecuadorian shrimp. But in the first quarter, average prices seemed to stabilize and even slightly improved, while in Q2 prices continued to drop, following 2022’s negative trend. The average price per kg of exports to the US continued to decrease through Q3. Like Ecuador, India’s exports to China saw a slight uptick in September. Time will tell whether this is the end of the negative price spiral or just a temporary recovery.
Source: Ministry of Commerce, India
Looking more closely at India’s export markets in the first three quarters of 2023, we can deduce that (Figure 8):
- India’s exports to its largest market, the US, dropped between 2021 and 2022. But in 2023, they stabilized and increased by 1% to 214,044 MT. Meanwhile, exports to Canada dropped by 5% to 14,522 MT.
- Exports to China increased by 3% to 104,819 MT in 2023. This was after a 16% growth between 2021 and 2022.
- Exports to other Asian markets increased by 1% to 64,567 MT. Vietnam remains the largest market, accounting for 33,860 MT; a 3% year-on-year increase. Exports to Japan account for 17,584 MT, a 6% year-on-year drop. Malaysia completes the top three with 3,327 MT, a 21% year-on-year decrease.
- Exports to the EU declined by 12% to 38,119 MT. Belgium and the Netherlands remain the largest markets in the EU at 15,088 MT and 7,905 MT, respectively. While exports to Belgium continued to grow (16% year-on-year), exports to the Netherlands dropped year-on-year by 15% to the 2021 levels. And exports to France, the third largest market in the EU, dropped by a whopping 54%.
- The ‘other Europe’ category saw an 80% year-on-year increase of exports to 16.771 MT in Russia, while exports to the UK declined by 7% year-on-year to 11,147 MT.
Source: Ministry of Commerce, India
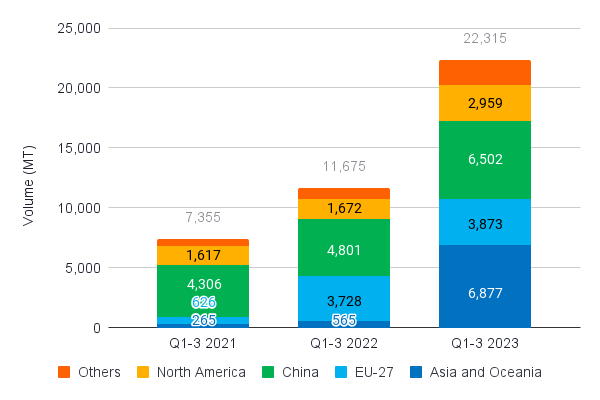
India’s P. monodon exports in 2023 almost doubled to 22,315 MT (Figure 9). While between 2021 and 2022 it was primarily the EU that absorbed most of the additional output, this role was taken on by other Asian markets and China between 2022 and 2023. An encouraging trend, as the EU and the US are not generally seen as significant growth markets for P. monodon, while in many Asian countries P. monodon (a native species) is the species of choice and consumers are willing to pay for it.
Source: Ministry of Commerce, India

Why India’s Drop in Broodstock Imports and Low Production Estimates Are Not Reflected in Today’s Export Volumes
Predicting India’s production dynamics is not an easy task. India has at least 100,000 farms, maybe even 150,000. The country is large, and the farming sector in different parts of Andhra Pradesh and other states such as Odisha, West Bengal, and Gujarat operate as relatively independent clusters where production dynamics may differ. While industry insiders in one area expect production to drop due to widespread disease, expanding production in other areas could quickly compensate for the expected decrease. This was, for example, the case in 2021 when shrimp farming in Krishna and West Godavari (Andhra Pradesh districts) in inland areas rapidly expanded.
Feed sales data could provide a good insight into actual production but unfortunately isn’t publicly available. The only available data are export data, and broodstock and PPL imports. In previous years, these have been a good indicator of production dynamics. For example, in 2021, India’s broodstock imports and export volumes were at a record level. There’s always a discrepancy between broodstock imports and actual production due to mortality or a gap between expected and actual demand once PLs are ready for sale. However, it’s always been a good indicator of market sentiment and helped predict production. In 2023, however, a drastic year-on-year drop of 27% in L. vannamei broodstock imports between January and October didn’t translate into a decrease in exports. How can this be explained?
- Some argue that amid low market prices and uncertainty about demand, farmers change their stocking strategies by lowering stocking densities, resulting in lower production costs. At the same time, it often results in better survival rates and possibly larger shrimp sizes at harvest. So, with less PL, farmers could produce about the same volume of shrimp at harvest.
- While L. vannamei broodstock imports dropped, imports of parent PL for local broodstock multiplication centers (BMCs) increased. In the first three quarters of 2023, local BMCs produced 8,200 more broodstock than in Q1-Q3 2022. This reduced the gap between 2022 and 2023 L. vannamei broodstock sales to hatcheries to 23%.
- At the same time, P. monodon broodstock imports and local broodstock production have increased by around 8,000. If we include this in 2023’s broodstock total, the gap between 2022 and 2023 is reduced to 19%. Still, that’s a big gap compared to the 2% export increase that we’ve just seen from the first three quarters of 2023.
- Some industry insiders argue that hatcheries may have been more efficient. This would mean that hatcheries produced more PL per female due to increased spawning, for example, longer use of the female or higher PL survival rates in hatcheries and farms. This could be the case if more disease-tolerant PL were used. This could apply to, for example, the increase in SyAqua broodstock and PL, which is believed to perform well in the face of white feces disease, or CP Kong stocks from API, which are also believed to be more disease tolerant.
- Although shrimp industry stakeholders from outside India point to the points above, most Indian stakeholders say that all these reasons are implausible. Instead, they argue that Indian exporters may have been selling stock from their stores as they say the common understanding in India is that this year’s production seriously dropped by at least 10-15%.

Vietnam
Figure 10 is based on mirror data from Vietnam’s six largest export markets. Vietnam itself doesn’t publish export volumes. As a result, the data presented represents the period in which the shrimp was imported into the market and not the period in which it was exported from Vietnam. This results in a small delay considering shipping times of a few days up to six weeks, depending on the market.
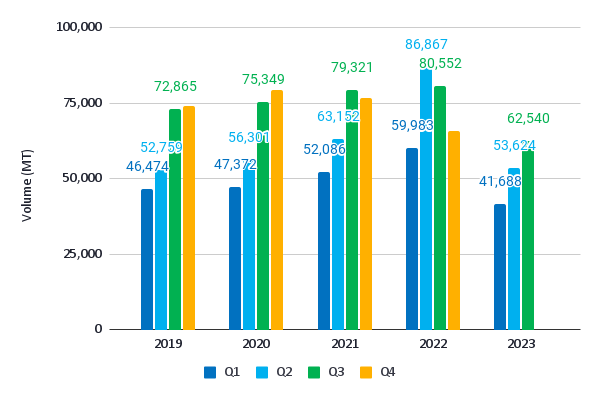
Despite an upward trend throughout the year, Vietnam’s exports to its six largest markets in the first three quarters of 2023 were still down year-on-year by 31%. Looking at each quarter separately, imports declined by 30% year-on-year in Q1, 38% in Q2, and 22% in Q3. In the third quarter, exports were down by 34% year-on-year in July, 18% in August and 15% in September. If this trend continues, Vietnam’s exports for Q4 will reach the same level as in 2022.
The export markets in the first three quarters of 2023 showed a downward trend:
- Exports to the US were down by 22% to 43,865 MT.
- Exports to the EU dropped by 39% to 31,325 MT.
- Exports to South Korea reduced by 13% to 31,932 MT.
- Exports to Japan were down by 21% to 30,179 MT.
- Exports to the UK dropped by 13% to 12,144 MT.
- Exports to China reduced by 72% to 8,405 MT.
Source: www.trademap.org

Indonesia
For Indonesia’s exports, I use data from the country’s Quality Inspection Agency which reports on a daily basis the volume of L. vannamei approved for exports. This doesn’t mean that the product has already been exported, but that it has been produced and processed and is ready for export. As such, it’s the most up-to-date and precise data for Indonesia’s L. vannamei exports.
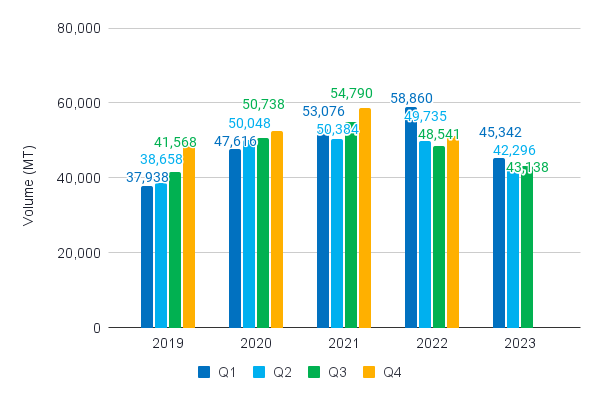
Just like Vietnam, Indonesia has seen a usual upward trend of export volume throughout the year. However, year-on-year exports in the first three quarters of 2023 dropped by 17%. Exports in Q1 dipped by 23% year-on-year, by 15% in Q2 and by 11% in Q3. In October, exports only fell by 7% compared to 2022. So the speed at which Indonesia’s export volume has been dropping year-on-year from Q4 2022 onwards is slowing down but the end doesn’t seem to be in sight.
Source: Quality Inspection Agency, Indonesia
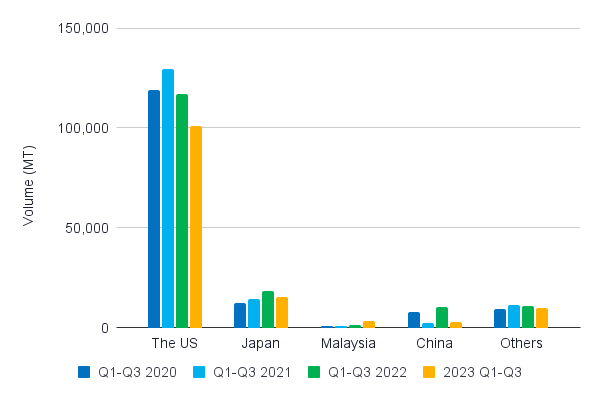
Indonesia’s exports to the US dropped for the second year in a row. After a decline of 10% from 2021 to 2022, exports dropped by another 16% from 2022 to 2023. After a steady increase from 2020 to 2022, exports to Japan dropped by 16% in 2023. The market in Malaysia remains small but is growing, also for Chinese shrimp exporters. This indicates that there might be more growth potential in sight. Indonesia’s exports to China remain highly volatile. It seems they partly depend on one large integrated shrimp farming project in Maluku, of which production is not very stable.
Source: Quality Inspection Agency, Indonesia

Thailand and China Remain the World’s Fifth and Sixth Largest Shrimp Exporters
Once the world’s largest shrimp exporters, today I often forget to keep an eye on the two countries. However, with a production of around 125,000 MT in 2022, Thailand and China remain the world’s fifth and sixth largest shrimp exporters even at a fraction of the export volumes they once achieved. Therefore, they deserve some attention in this blog.
Thailand
While export volumes dropped considerably from the peak of over 400,000 MT in 2010, Thailand’s exports stabilized in 2018 at around 125,000 MT. The vast majority, around 110,000 MT in 2022, is accounted for by L. vannamei. The remainder is primarily P. monodon and a tiny quantity of M. rosenbergii.
Source: ITC Trademap
While the total volume dropped, the division between raw and value-added remained around 50-50. Thailand has always imported shrimp for reprocessing and before 2010 did so mainly from Indonesia until imports from that country dropped. Since 2010, imports from Argentina grew and from 2016 they’ve been fluctuating between 5,000-8,500 MT. In 2018, import volumes from Ecuador started growing and peaked at 14,128 MT in 2021 before dropping to 7,850 MT in 2022.
All of Thailand’s previous largest export markets for raw shrimp—the US (59,830 MT), Japan (35,026 MT), and Canada (11,049 MT)—have shrunk since 2012. On the other hand, new markets such as China and Taiwan (Republic of China) have opened up. In 2022, Thailand’s top five export markets were China (21,566 MT), Japan (11,694 MT), the US (11,489 MT), Taiwan (6,542 MT), and South Korea (2,855 MT).
The UK and Canada—previously the third and fourth most prominent markets for Thailand’s value-added shrimp products—no longer import significant quantities from Thailand. Meanwhile, Japan (25,999 MT) and the US (23,452) remained the two largest markets in 2022, although their import volumes more than halved compared to 2012.
In the first three quarters of this year, exports reached 84,055 MT, 12% down year-on-year. Amidst today’s oversupply circumstances, the 2023 year-total export volume may decrease to around 110,000-115,000 MT.
Source: Ministry of Commerce, Thailand
China
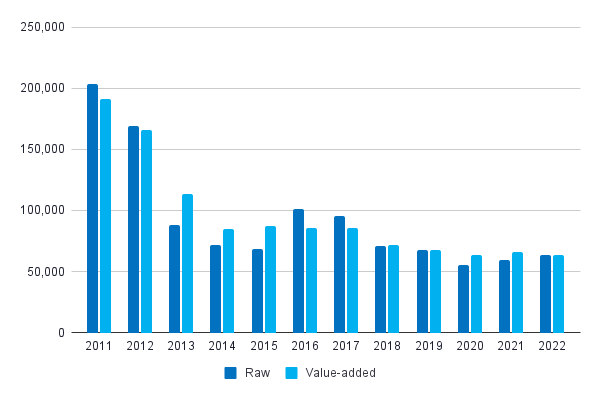
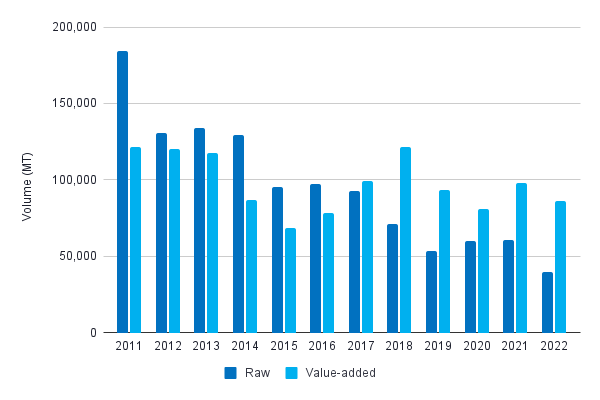
Just like Thailand, exports from China have dropped from a peak of just over 300,000 MT in 2011 to around 125,000 MT in 2022. But contrary to Thailand, the shopping basket has drastically changed, with raw shrimp exports plummeting. Exports of raw shrimp today mainly consist of wild-caught shrimp, which we also see when looking at the export markets in Figure 15. Meanwhile, value-added shrimp exports remained relatively stable.
Source: China Customs
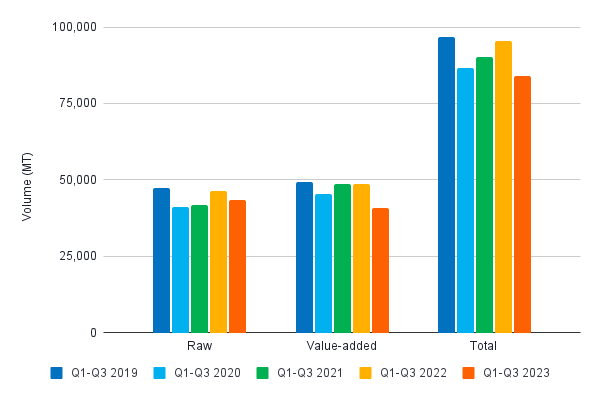
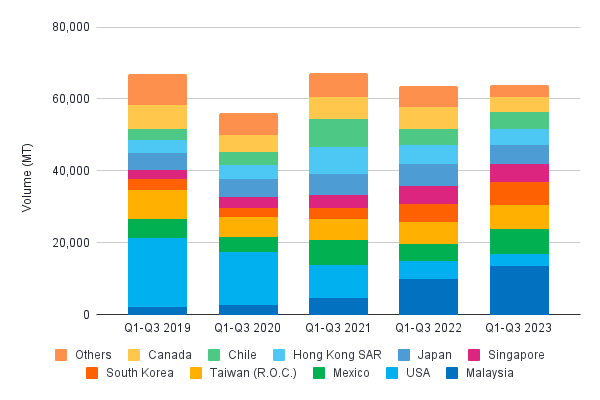
Looking at this year’s value-added shrimp exports is easiest by comparing performance of the first three quarters with that of previous years. Figure 15 clearly shows that value-added shrimp exports remained stable, though looking at the export markets reveals interesting trends. Most significantly, exports to the US have declined, while Malaysia has become China’s most important export destination for value-added products. Other markets like Mexico, Taiwan (Republic of China), South Korea, Singapore, and Japan have remained relatively stable. The vast majority of value-added shrimp exports likely consist of L. vannamei.
Source: China Customs
Exports of raw shrimp from China increased in 2020 and 2021 but plummeted again in 2022. And as the Q1-Q3 data in Figure 16 shows, they likely won’t recover in 2023. Most raw shrimp exports from China consist of wild-caught raw and blanched PUD (S. melantho). This is confirmed by export markets such as Spain, Japan, the US, and Portugal, where the wholesale sector uses this type of shrimp as a cheaper option.
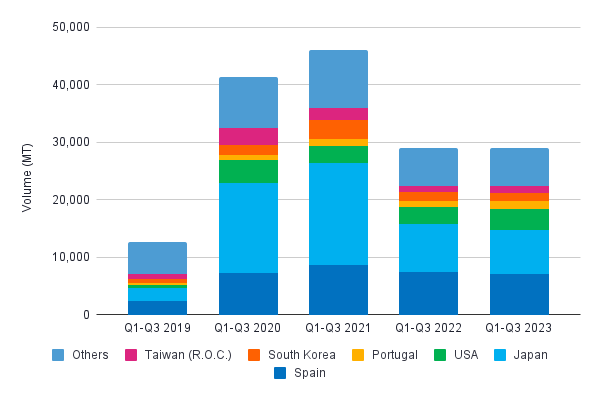
Source: China Customs

New Anti-Dumping Case, If Won by the US
On 25 October 2023, the American Shrimp Processors Association (ASPA) filed petitions with the US Department of Commerce (DOC) and the US International Trade Commission (ITC), seeking antidumping duties (ADs) on imports of frozen warmwater shrimp from Ecuador and Indonesia, and countervailing duties (CVDs) on such imports from Ecuador, India, Indonesia, and Vietnam. ADs should protect the US market from low priced shrimp being dumped on it, while CVDs apply to shrimp that has benefitted from government subsidies in its country of origin. The petition has been extensively reviewed by lawyers such as Akin Gump and can be read about in more detail here.
In 2005, the DOC published AD orders on frozen shrimp from China, India, Thailand, and Vietnam, which remain in place today. If successful, the new petitions would make importers of frozen shrimp from India and Vietnam that are already subject to AD requirements liable for CVD, and would impose new AD and CVD liability on importers of frozen shrimp from Ecuador and Indonesia.
In 2012, the Coalition of Gulf Shrimp Industries filed a similar petition, though only requesting CVD investigations into frozen warmwater shrimp from China, Ecuador, India, Indonesia, Malaysia, Thailand, and Vietnam. However, after investigation, US authorities ruled against that petition because it stated that imported shrimp didn’t negatively impact prices of shrimp produced in the US and as such imports weren’t responsible for US producers’ financial performance. While the US market landscape may have changed in the last decade, Akin Gump states that the ITC’s prior findings could complicate ASPA’s arguments in the most recent petition.
Although chances are that the ruling will be negative, Akin Gump explains that if the ITC and DOC make a preliminary decision in favor of the petitioners, US importers will be required to post cash deposits in the amounts of the estimated ADs and/or CVDs for all entries from the date the decision is announced. The DOC will publish country-specific AD and CVD rates, but preliminary rates can often change in the final DOC determinations. The recent petitions include a wide range of wild-caught and farmed shrimp in both raw and value-added product types. Only breaded shrimp is excluded. The petitioners allege dumping/subsidizing rates of 4.8 to 111.4% for Ecuador and 4.85 to 37.36% for Indonesia. No country-specific claims of subsidy rates are mentioned for the other countries.
The investigation started on 14 November 2023. According to the estimated schedule published by Akin Gump, the ITC would determine preliminary injuries by 11 December 2023, the DOC would determine preliminary CVDs by 25 March 2024 and preliminary ADs by 22 May 2024. It would then take until 9 December 2024 before AD and CVD orders would be published.
Looking Ahead
It’s extremely hard to predict shrimp exports over the next couple of months. Although based on weather conditions and prices, you would expect exports to slow down, other factors such as consolidation and competition for maintaining or expanding market shares may result in another period of volume growth. Let’s keep some things in mind when we think about the upcoming period:
- El Niño adverse weather conditions: El Niño may cause adverse weather conditions which may slow down production in Ecuador especially but also in other regions in Latin America and other parts of the world. Ecuador’s farms may risk flooding and more rainfall may cause higher disease pressure in Latin America and Asia alike. Combined with the start of the winter season in Asia, El Niño may reduce output in Q4.
- Drop in Indian production still to be expected: Although India’s drop in broodstock imports so far has not been translated into a drop in exports, many industry stakeholders in India are certain that 2023’s production has in fact dropped. They argue that this year’s unexpected export volumes at least partly consisted of products harvested in 2022. They expect the drop in broodstock imports will eventually result in a drop in exports. Many stakeholders still expect an actual 10-15% drop in farmed shrimp production in India for 2023.
- Prices unlikely to strongly rebound: The rate at which average export values per kg dropped has declined compared to 2022. However, they’re unlikely to strongly recover. Even though we’ve entered the holiday season and prices would normally strengthen in Q4, with current supply volumes and expected stocks already in the market this is unlikely to happen. We might see average export volumes stabilize or slightly improve towards the end of the year at best.