Building up to the Boston Seafood Show in March this year, I have decided to split this second part of my blog on the US importers into several more pieces as the NOAA’s import data and Urner Barry’s Foreign Trade Data simply provide too many insights to fit into this second part. In this part, I will elaborate on the NOAA’s import data. Then, over the next couple of weeks, short blogs on Ecuador, India, Indonesia, and Vietnam will follow.
The Shrimp Blog is supported by: Inve Aquaculture, Benchmark Shrimp Genetics, Shrimp Improvement Systems, SPF Shrimp Feeds, Megasupply, DSM Animal Nutrition, Taprobane Seafood and Verwijs Import, Zeigler Nutrition, and Grobest.

To What Extent Do the US’s Major Suppliers Really Compete with Each Other?
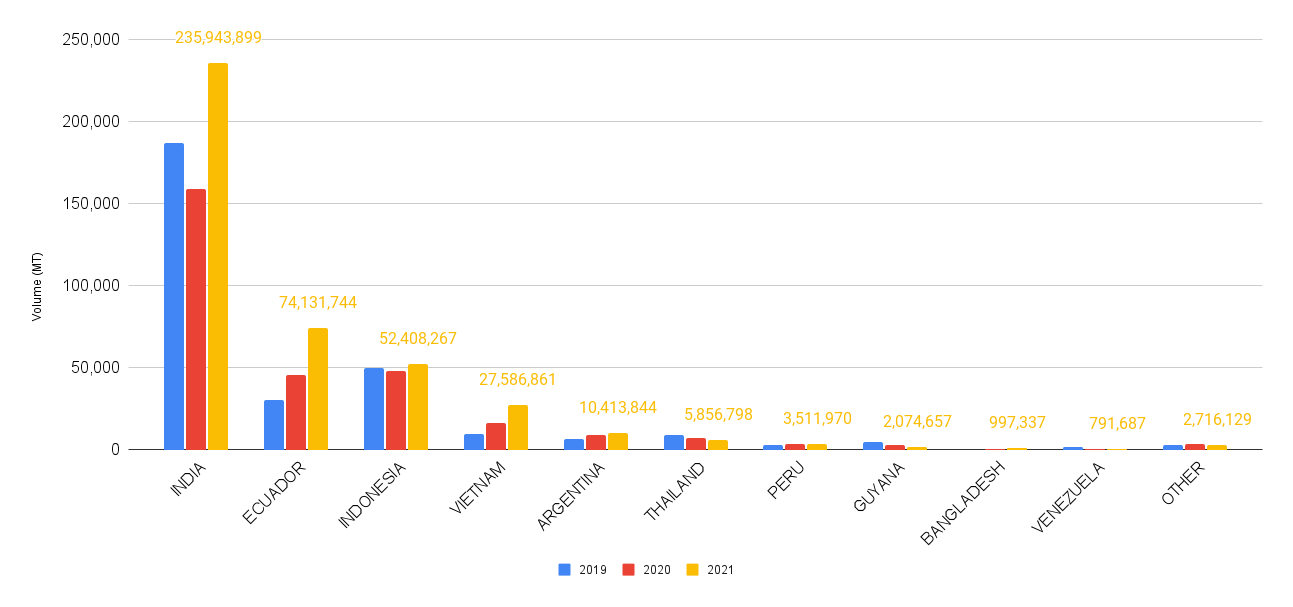
As we can clearly see from Figure 1, the US’s top 4 suppliers of shrimp have all managed to increase their exports since 2019. In contrast, the other eight suppliers have struggled to maintain their market shares. I have started to wonder to what extent they really compete with each other. To dig a little deeper, I looked at the various product types supplied by these countries and whether they are actually in direct competition or whether they are all carving out their own niches in the US market.
Figure 1: Top 10 US shrimp suppliers and their volumes from 2019-2021
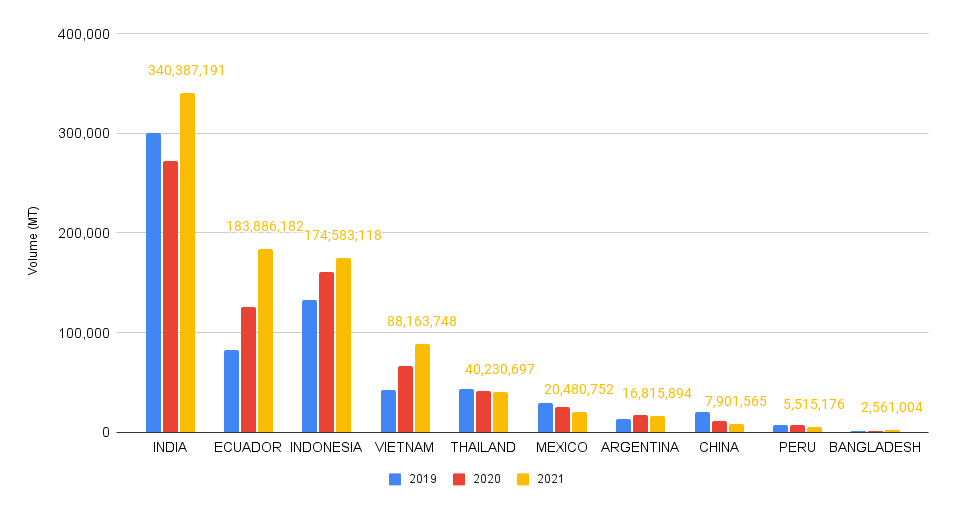
Source: NOAA
With A 37% Market Share, Ecuador Has Become the Largest Supplier of Shell-On Shrimp, Directing India to Third Place
The frozen shell-on warmwater shrimp category in the NOAA’s data is a combination of raw HLSO, raw HLSO easy peel and raw HOSO products. The division between these three categories is unclear but most likely around, respectively, 50/45/5%. In this section, I will refer to all frozen shell-on warmwater shrimp as shell-on products.

The total volume of this category increased from 244,540 MT in 2019, 267,280 MT in 2020, to 275,002 MT in 2021. After peeled shrimp, it’s the largest category within US shrimp imports but its share of total US shrimp imports dropped from around 35% in 2019 to around 30% in 2021. Ecuador more than doubled its supplies of shell-on products to 101,490 MT in 2021, accounting for 37% of total US imports of this category, up from 21% in 2019. India’s share of total imports of shell-on products dropped from 35% in 2019 to 22% in 2021. Indonesia outperformed India’s supplies of shell-on products by just a couple of MT and also accounted for 22% of total supplies of shell-on products in 2021.

The interesting part is that contrary to peeled products, this category is divided according to shrimp sizes (Figure 2). What does this mean in terms of which of the top 4 suppliers to the US have driven imports of the different sizes of shell-on products?
Figure 2: A breakdown of US imports of shell-on products according to size categories from 2019-2021
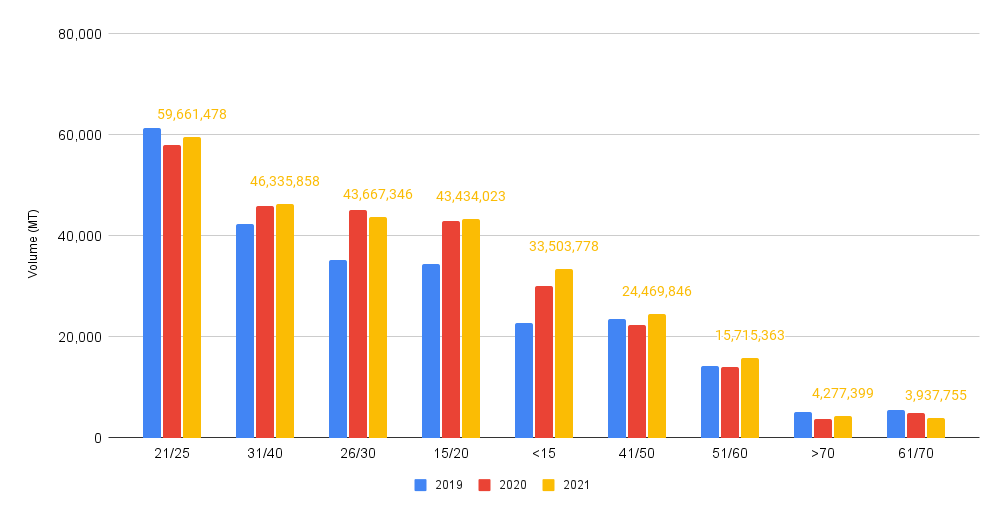
Source: NOAA
The four countries – Ecuador, India, Indonesia, and Vietnam – combined represent 66% (<15) and 80% (15/20) of total US imports of the biggest size categories (Table 1). Indonesia overtook India as the largest supplier, accounting for respectively 21% and 34% of imports of these two sizes combined. Although India was still the second largest importer, Ecuador and Vietnam are advancing. While Ecuador was still the smallest importer of both categories in 2019, in 2021 it has become respectively the second and third largest importer, accounting for 18% of each size category. Although still small compared to the other three, Vietnam also records strong growth. India is the only country that has seen its supplies to the US of these sizes drop.
Table 1: The top suppliers to the US of larger sizes shell-on products from 2019-2021
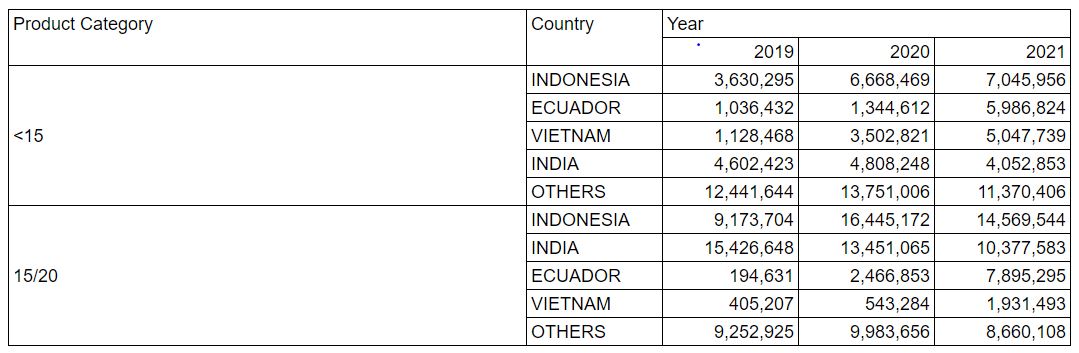
Source: NOAA
In the larger mid-size categories (21/25 and 26/30), we see a different situation unfolding. From these sizes onwards, even though its volume is increasing, Vietnam no longer plays a serious role. The other three countries combined account for respectively 84% and 87% of total imports of these sizes. India is still the largest supplier, alone accounting for 33% and 36% of total US imports. But its share is dropping rapidly. Especially for 21/25, India’s supplies dropped from 35,298 MT in 2019 to only 19,612 MT in 2021. For 26/30, its market share remained relatively stable. 21/25 is also the only major size category that did not report overall growth. The drop in India’s supplies of 21/25 is partly compensated by Ecuador, which increased its supplies from 3,408 MT in 2019 to 15,072 MT in 2021, 25% of total imports of this size. In the 26/30 category, Ecuador even accounted for 32% of US imports in 2021, having increased its exports from 3,822 MT in 2019 to 15,158 MT in 2021. Indonesia, although at slower rates than Ecuador, also grew its supplies and accounted for 25% and 19% of each size respectively. Although India is still the largest supplier of these sizes, it’s not unlikely that Ecuador takes over within the next three years.
Table 2: The top suppliers to the US of larger mid-sizes shell-on products from 2019-2021
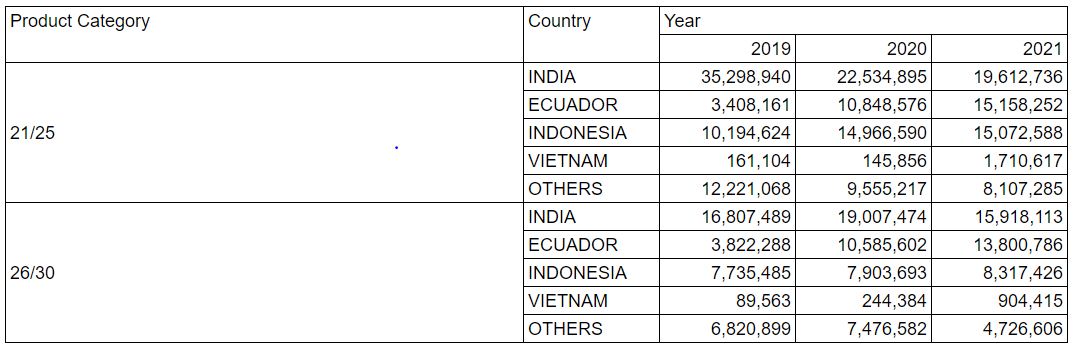
Source: NOAA
If we then look at the smaller mid-sizes (31/40 and 41/50) and the smallest sizes (51/60, 61/70 and >70), we see that Ecuador has consolidated its position as the largest supplier. Ecuador had already taken over from the other countries before 2019 but while India and Indonesia saw their volumes remain stable or drop, Ecuador saw its volume increase. This is especially the case for the smaller mid-sizes of 31/40 and 41/50, where Ecuador saw its exports grow by 72% and 42%, respectively. For these two categories, Ecuador alone now accounts for 58% and 66% of total US imports of these sizes.

Table 3: The top suppliers to the US of some of the smaller mid-sizes and small shell-on products from 2019-2021
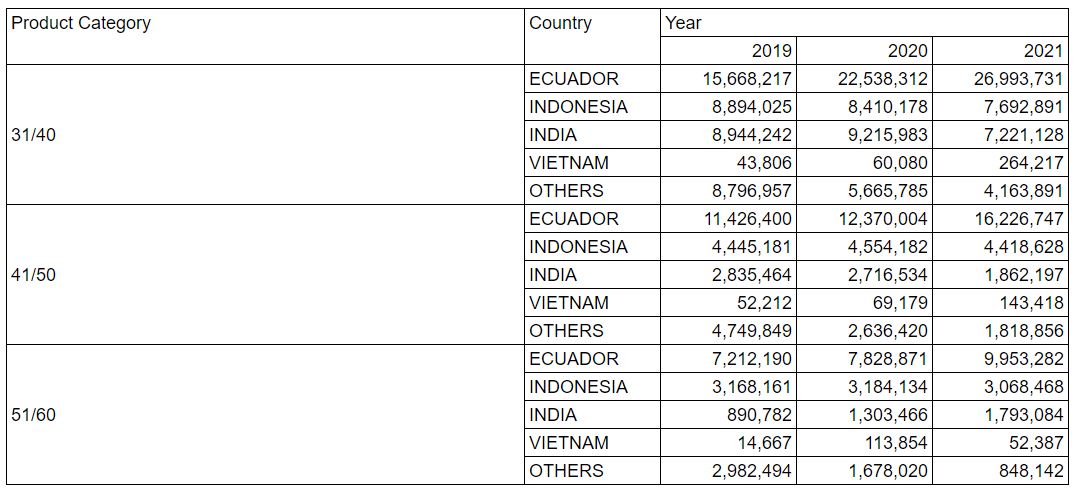
Source: NOAA
India’s Maintains Position as Largest Supplier to the US of Peeled Shrimp but Ecuador’s Rise Can’t Be Ignored
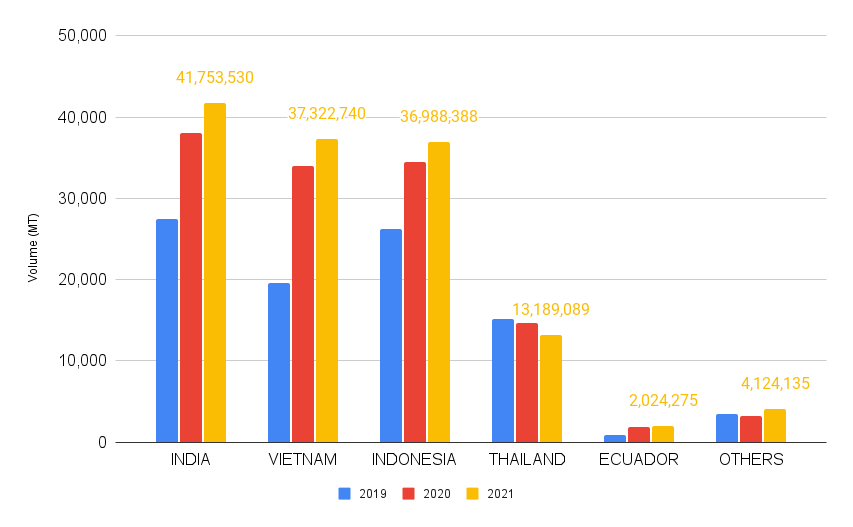
Frozen peeled warmwater shrimp (peeled shrimp) is the largest category of products imported to the US. Total imports of this category surged from 305,783 MT in 2019 to 416,433 MT in 2021, accounting for two thirds of the total increase of US shrimp imports over that period. Figure 3 breaks down total US imports of peeled shrimp according to the top 10 suppliers of this product category.
Figure 3: Top 10 suppliers to the US of frozen peeled warmwater shrimp from 2019-2021
Source: NOAA
After a dip in 2020 related to COVID-19 disruptions of its shrimp industry, India exported almost 236,000 MT of peeled shrimp to the US in 2021. This accounted for 57% of the US’s total imports, down from 61% in 2019. Ecuador has increased its exports of peeled shrimp to the US from 30,156 MT in 2019 to 74,132 in 2021. This is the first year that Ecuador exports more peeled shrimp to the US than Indonesia, which saw its exports of peeled shrimp to the US grow by only 5%, and whose overall market share dropped from 16% in 2019 to 13% in 2021.

Unfortunately, contrary to shell-on products, the NOAA does not provide a breakdown of sizes for peeled shrimp. However, I believe that it’s reasonable to assume that these countries’ contributions to the supplies of the different size categories of peeled products are similar to their contributions to the supplies of shell-on products. The trend of Indonesia accounting for most of the larger sizes, India accounting for most of the mid-sizes and Ecuador accounting for most of the smaller sizes can also be observed for peeled products. And for peeled products, too, it’s likely that Ecuador will slowly start competing for market share in the other categories.

Interestingly, Vietnam saw its volume of peeled shrimp exports to the US increase by 281%, fastest of all top 10 suppliers. Although with 27,586 MT, the country still only accounted for 7% of total US peeled warmwater shrimp imports, it shows that Vietnam is on the rise in terms of these value-added products and likely to compete with Indonesia and India for the larger and mid-sizes.
India Remains the Largest Supplier of Most Value-Added Products but Vietnam and Indonesia are Closing In
Value-added products (other than breaded products, as these are reported separately) accounted for 135,402 MT in 2021, up from 92,586 MT in 2019. This category mainly consists of cooked shrimp and accounts for around 15% of total imports. With a growth of 46% since 2019, in relative terms this category seems to have benefitted most from the surge of US imports during the pandemic. Figure 4 provides a breakdown of imports of value-added products according to the main suppliers.
Figure 4: Top suppliers to the US of value-added (other than breaded) shrimp from 2019-2021
Source: NOAA
Figure 4 shows that the imports of value-added products are dominated by India, Indonesia and Vietnam. All three countries managed to increase their supplies significantly, especially from 2019 to 2020 but also from 2020 to 2021. India remains the largest supplier, accounting for 31% of total imports, followed closely by Vietnam and Indonesia. Vietnam clearly increased its supplies the most. Jointly, the three countries account for 86% of total imports of value-added products. Thailand accounts for 10% of imports, but is not benefitting from the growth of US imports as we’re seeing its volumes drop.
Indonesia Takes Over as the Largest Supplier of Breaded Shrimp, Beating Competition and Directing China to Fourth Place
Breaded shrimp is a high-value product compared to other shrimp products. Although with 62,182 MT only accounting for 7% of total shrimp import volume, it is an interesting product to look at in a bit more detail. Figure 5 provides a breakdown of breaded shrimp imports according to the top suppliers.
Figure 5: Top suppliers to the US of breaded shrimp from 2019-2021
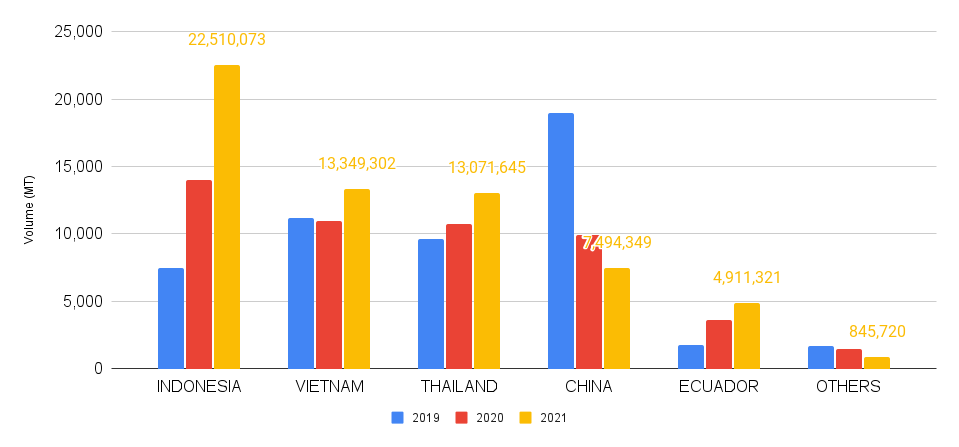
Source: NOAA
China has of course been confronted with tariff barriers and as a result has not been able to continue shipping large volumes of breaded shrimp to the US. However, it was still the fourth largest supplier of breaded shrimp to the US in 2021. Indonesia, in 2019 the fourth largest supplier of breaded shrimp to the US, had become the largest supplier in 2021, with 22,510 MT. Vietnam and Thailand, both good for around 13,000 MT, have only slightly increased their exports of breaded shrimp to the US and were the US’s second and third largest suppliers of breaded shrimp in 2021.
Interestingly, while not playing a serious role in the supplies of other value-added products, Ecuador has become the US’s fifth largest supplier of breaded products. This product is mostly coming from a single supplier that has teamed up with a US partner who takes care of distribution. India, while having expanded its exports of other value-added products, is not yet playing a serious role in the exports of breaded products.
Conclusion
Although Undercurrent News was right that India won the gold medal and Ecuador won silver in the shrimp Olympics, with this blog I hope to have shown that the situation is actually much more multifaceted. A detailed understanding of the US market is required to understand what the future may hold for specific suppliers.

While India is still by far the largest supplier of shrimp to the US, Ecuador is the big winner in terms of overall growth rate. It overtook Indonesia as the US’s second largest shrimp supplier, but it also currently only has a strong competitive edge for specific products. While Ecuador has become the largest supplier of shell-on products (especially the smaller mid-sizes and small sizes), it is far from taking over India’s position with regard to peeled and other value-added products, and even further from overtaking Indonesia with regard to breaded shrimp.
Stay tuned for the next couple of short blogs where I turn back to Urner Barry’s Foreign Trade Data to look at which companies are driving exports from Ecuador, India, Indonesia, and Vietnam individually.