It’s 100% clear that Indian shrimp farmers are in crisis mode, confronted with extraordinary low farm gate prices and high input costs. Their margins, if any still exist, have been squeezed. However, I’m not convinced that this will result in a 20%, or, as some media reported, even 30% production drop for calendar year 2022. Looking further ahead, as broodstock imports and shrimp exports have plummeted in October and November, such a decrease may happen in the first quarter of 2023. This would result in a strong negative growth of India’s financial year 2022-2023, running from April 2022 to March 2023. In this blog, I use shrimp export data and broodstock import data to prove my point. A more detailed look at this data reveals other interesting trends which I won’t withhold from you.
The Shrimp Blog is supported by: Inve Aquaculture, Benchmark Shrimp Genetics, Shrimp Improvement Systems, SPF Shrimp Feeds, Megasupply, DSM Animal Nutrition, Taprobane Seafood and Verwijs Import, Zeigler Nutrition, and Grobest.

SHRIMP EXPORT DATA DOES NOT YET SHOW 20-30% DECLINE. FROM JANUARY-OCTOBER Y-O-Y EXPORTS WERE DOWN BY 5%
Let’s first look at India’s monthly total shrimp exports in 2021 and 2022 (Figure 1). For this analysis we want to exclude as much wild-caught shrimp as possible. Therefore I limit the data to 8-digit HS codes HS03061720 (raw L. vannamei) and HS03061740 (raw P. monodon), and 6-digit HS codes HS160521 and HS160529, both referring to cooked and value-added wild-caught and farmed shrimp. Unfortunately, we cannot exclude wild-caught shrimp from these last two HS codes, but I believe the majority of the volume reported under these HS codes is farmed shrimp. The 8-digit HS codes have been reported only since April 2020, enabling us to look at calendar years 2021 and 2022, as well as financial years 2020-2021, 2021-2022, and 2022-2023.
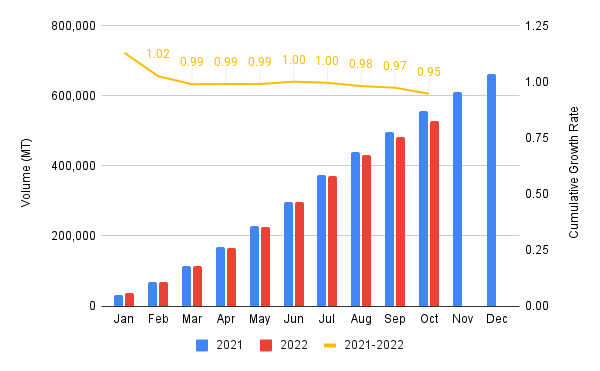
Source: Ministry of Commerce
Note: this figure combines export volumes under HS030620 (raw L. vannamei), HS030640 (raw P. monodon), HS 160521, and HS 160529 (both cooked and value-added P. monodon and L. vannamei, and cooked and value-added wild-caught shrimp).
After a year-on-year (Y-O-Y) export increase in January 2022, India’s cumulative total shrimp exports under the relevant HS codes have been more or less on a par with 2021 until July (Figure 1). But from August onwards, India’s exports started to underperform compared to 2021 by 10% in August, 8% in September, and 27% in October, respectively. This resulted in a Y-O-Y negative growth of 2022’s total export volume: 2% in August, 3% in September, and 5% in October. Though we’re still awaiting data for November and December, we can imagine that if this trend continues, exports may show a further Y-O-Y decline. However, it’s unlikely that the year’s total exports will drop by more than 10% as data does not support this.
TAKING A CLOSER LOOK AT INDIA’S EXPORT DATA
The detailed 8-digit HS code data as published by India’s Ministry of Commerce provides valuable insights into trends for different Indian shrimp export products.
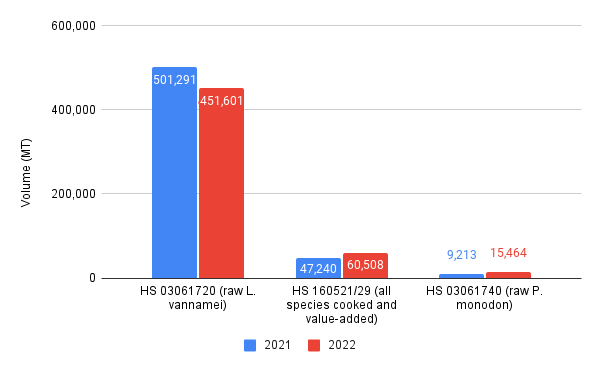
Source: Ministry of Commerce
Note: this figure combines export volumes under HS030620 (raw L. vannamei), HS030640 (raw P. monodon), HS 160521, and HS 160529 (both cooked and value-added P. monodon and L. vannamei, and cooked and value-added wild-caught shrimp).
Interestingly, if we take a closer look at the export trend per HS code, we see that it’s especially exports of raw frozen L. vannamei shrimp that have dropped by 10% compared to the same period in 2021 (Figure 2). In August, September, and October, exports under this HS code dropped by 14%, 15%, and even 33%, respectively.
The US is the main cause of this drop. Y-O-Y imports into the country of Indian shrimp under this HS code started declining significantly from June onwards, with the biggest dip in August when imports dropped by 46% compared to the same month in 2021. The year’s total US imports of Indian shrimp under this HS code are now down by 39%. The drop in the US was partly compensated for by an export increase under this HS code to the EU (+ the UK) and China. By October, the EU (+ the UK) had increased its total imports from India Y-O-Y by 20%, while China had increased its imports by 14%. In the case of the EU, this may indicate that both Indian exporters and their EU buyers are less concerned about stringent measures related to antibiotics in Indian shrimp which for several years restrained India’s exports to the EU due to associated costs and risks.

While raw frozen L. vannamei exports declined, cooked and value-added product exports (mainly L. vannamei) have increased drastically from 47,000 MT in 2021 to 61,000 MT in 2022. This increase is primarily absorbed by the US and as such compensates partly for the decline in raw frozen L. vannamei exports. If we combine raw frozen with value-added product exports to the US, the US’s year-total import volume from India declined by “only” 33%. It might be a sign that with increased competition from Ecuador for raw frozen products, Indian exporters are focusing more on cooked products, which are still outside Ecuador’s scope.
Raw P. monodon exports have also increased Y-O-Y, reaching a year total of 15,500 MT in October. That’s up by 68% compared to the same period in 2021. Although still small compared to L. vannamei, P. monodon farming in India is definitely gaining some momentum. With the main harvesting season as late as October, the trend of P. monodon farming may become clearer once statistics of the rest of the year become available. The increased output of P. monodon shrimp is almost entirely absorbed by buyers from north-western Europe who imported almost 5,000 MT so far in 2022, up from just 1,000 MT in 2021. Buyers from Belgium, Germany, and the Netherlands—traditionally larger markets for Asian P. monodon shrimp—are clearly complementing or replacing their supplies from Bangladesh with Indian shipments.
BROODSTOCK IMPORTS SUGGEST RELATIVELY STRONG SECOND 2022 CROP, BUT PLUNGE FOR THE FIRST 2023 CROP
While India’s shrimp exports at the start of the year were quite on a par with 2021 (Figure 1), broodstock imports were running behind 2021 numbers (Figure 3). It was only between August and October that broodstock imports outperformed 2021. This can mainly be explained by the fact that in 2021 broodstock imports halted in July and August because of the closure of the Aquaculture Quarantine Facility, while in 2022 broodstock imports continued during those months. But September and October 2022 also showed higher broodstock imports compared to 2021: respectively 19% and 23%, indicating strong demand.
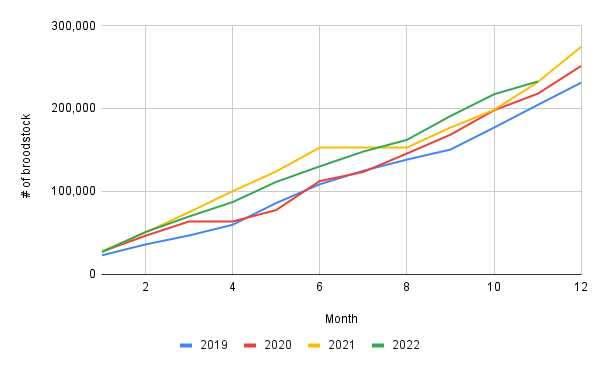
Source: Coastal Aquaculture Authority
Although farmers have been suffering tremendously from low prices, the large amount of broodstock imports between August and October lead me to believe that second crop harvest volumes have been significant. While export volumes seem to have plummeted from October 2022 onwards, Indian processors have likely purchased raw materials at a low price and amidst sluggish overseas demand have stocked the cheap raw materials in their cold stores for further processing and exporting when demand resumes. Even though exports may have dropped further in November and December, I don’t think that this would represent a production drop equal to those last months of 2021.
After the steep broodstock imports between August and October, November shows a sudden and drastic drop. The Coastal Aquaculture Authority (CAA) reports imports of only 15,000 broodstock, far below the 34,000 broodstock imported in November 2021. In December 2021, India imported as much as 43,000 broodstock. If this year’s import drop continues in December, we may really start believing that production for the first crop of 2023 will drop significantly compared to that of 2022.
Broodstock imports in November and December would normally cater to the first production season of the next year. With this drop in imports and these farm gate price levels, hatcheries may very well expect most farmers not to be ready to stock up their ponds for the first crop of 2023, or delay their stocking until later in the second quarter of 2023. This may become challenging for processors who need raw material to fulfil demand during the traditional buying season in April/May next year. At the same time it will be good for farmers as prices may recover soon to encourage them to stock their ponds as early as possible to prevent a raw material shortage. Farmers with shrimp in their ponds during this period may benefit from the farm gate price recovery.
Keeping in mind all this data, the change in broodstock import trend leads me to believe that shrimp production is not unlikely to take a nosedive in the first quarter of 2023 for financial year 2022-2023.
BROODSTOCK IMPORT TRENDS: SIS LOSING MARKET SHARE TO NEW PLAYERS AND BMCS OPERATING AT CAPACITY
Indian hatcheries have two sources of broodstock: imports and local BMCs. So far in 2022, both broodstock imports and local production by BMCs are at speed. In this section I will highlight some developments that can be distilled from the broodstock import data as published by the CAA.
One hatchery owner emphasizes that we need to take the broodstock and parent post-larvae (PPL) import data with a pinch of salt. Broodstock imports don’t necessarily equal post-larvae (PL) sales. The largest broodstock importer doesn’t have to be the largest PL producer. All statements here must therefore be seen in that perspective. However, it’s still the best data to gain insight into the state of affairs of the various companies involved.

Source: Coastal Aquaculture Authority
CP Aquaculture India Back in the Game with Large Amount of Imports Complemented with Local BMC Broodstock
CP Aquaculture India (CP) has drastically increased its use of broodstock in 2022. Besides having imported around 15,000 broodstock directly (a significant increase compared to previous years), the company also acquired the full output of the first production cycle of the government-operated BMC in Andhra Pradesh. According to CAA data, the BMC imported two batches of 22,000 and 23,000 PPL from Global Gen in Indonesia. From that first batch, the BMC is said to have produced and sold 3,400 broodstock to CP. If these numbers are correct, CP would have the pole position in terms of its broodstock use in 2022. More importantly, CP provided Global Gen a way back into the Indian market. Global Gen hasn’t been very active in previous years, but with the contract to supply the BMC it has the opportunity to show the quality of its broodstock and possibly regain some market share.
Sea Products Development Supplying PPL to BMR Blue Genetics; BMR Industries Becomes Runner-Up in Terms of Use of Broodstock
While Blue Genetics lost its approval to export broodstock to India, since acquiring Texas-based Sea Products Development (SPD), it regained access to the Indian market. SPD only supplied a small number of broodstock to the Indian market in 2022. More interestingly, BMR Blue Genetics (the JV through which Blue Genetics and BMR Industries run a BMC in India) has started importing significant amounts of PPL from SPD. According to the CAA, SPD supplied two batches of around 60,000 PPL each to BMR Blue Genetics: one in March and one in July. From the first batch, the BMC is said to have supplied 4,300 broodstock to BMR’s hatcheries. Data from the second batch is not yet available. Adding this number to BMR’s 12,000 direct broodstock imports would put BMR in third position in terms of its use of broodstock, right after Sapthagiri hatcheries. Vaisakhi Bio Marine would still be the third largest broodstock importer, but if we include CP’s and BMR’s broodstock purchases from the BMCs, Vaisakhi Bio Marine dropped to the fourth place in 2022.
Shrimp Improvement Systems Losing Market Share to Benchmark and SyAqua
Two relative newcomers on the market that have gained significant market shares are Benchmark and SyAqua. They managed to grow their market shares to 5% and 9% respectively, both supplying a wide range of hatcheries. The market share gain of these newcomers has come at the cost of other companies, especially Shrimp Improvement Systems (SIS). While in 2021 and 2022 the company was responsible for over half of India’s broodstock imports, its market share in 2022 so far is stuck at 44%. After struggling with COVID-19 logistical challenges in Hawaii, Kona Bay grew its market share by 2% to 39%. We may expect growth from Kona Bay once its BMC with Sapthagiri is established and operational.
P. Monodon Broodstock and PPL Supplies Growing to Meet Demand of P. Monodon Farming Operations
Both Moana Technologies and Unima have been supplying P. monodon broodstock to India. Moana Technologies has supplied exclusively to Khushi Shrimp Hatchery, operated by Vaishnavi Aquatech, while Unima’s broodstock has been supplied to Unibio and Gaayathri Biomarine. Besides importing broodstock, CAA data also shows that Vaishnavi Aquatech imported its first batch of 33,000 PPL. This signals that its new BMC has come into operation. Perfect timing: the PPL imports produced broodstock that could cater to the main P. monodon farming season.
Interested in more insights into India’s broodstock imports? Contact me at willem@shrimpinsights.com.

CONCLUSION
Although this year’s numbers likely won’t show more than a 10% drop in export volume, all data points towards a stronger drop in the first quarter of 2023. This will result in a Y-O-Y plunge for financial year 2022-2023.
While export prices to the US already started dwindling right from the start of 2022, this didn’t apply to export prices to the EU (+ the UK) and China until September and October 2022. The price drop in India’s second and third largest export markets triggered panic among India’s farmers who had by then already stocked their ponds, but were confronted with extremely low farm gate prices. At that time, demand from most markets was at a low point. Processors and exporters thus have likely bought the raw material at very low prices and used it to build stocks, primarily within India as cold stores in the US were already full. The extremely low prices combined with no sign of demand increase most likely resulted in the broodstock imports drop in November 2022. With these numbers, hatcheries may very well anticipate a lack of demand from their customers, resulting in a very moderate or possibly delayed stocking of the first crop of 2023.
If stocking for the first crop of 2023 will be modest and demand from overseas markets increases in the spring of 2023, it will hopefully help recover Indian farm gate prices and bring them back to a level from which farmers can make a decent margin. This would then lead to a better outlook for the remainder of 2023. However, if farmers are triggered to stock their ponds at higher rates due to a farm gate price recovery between now and February, which usually happens as processors try to encourage farmers to stock, 2023 may become a very uncertain year for India’s shrimp output.