Totals (YTD)
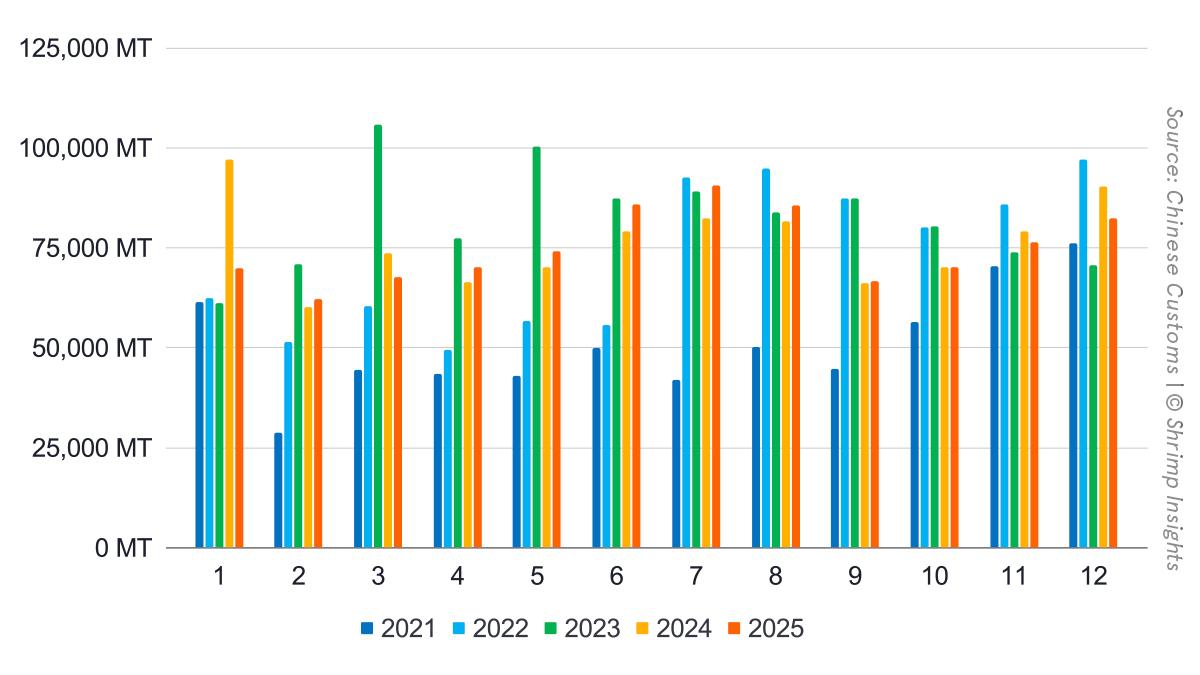
Based on full-year 2025 (YTD) data, China’s shrimp imports ended the year slightly lower in volume but higher in value, underscoring a price-led market rather than a volume-driven one. Total imports reached 901,563 MT, down 2% YoY, while import value increased to USD 4.79 billion (+5% YoY). December volumes fell to 82,409 MT (-9% YoY), confirming softer year-end buying and preventing a return to positive year-over-year volume growth.
Suppliers (YTD)
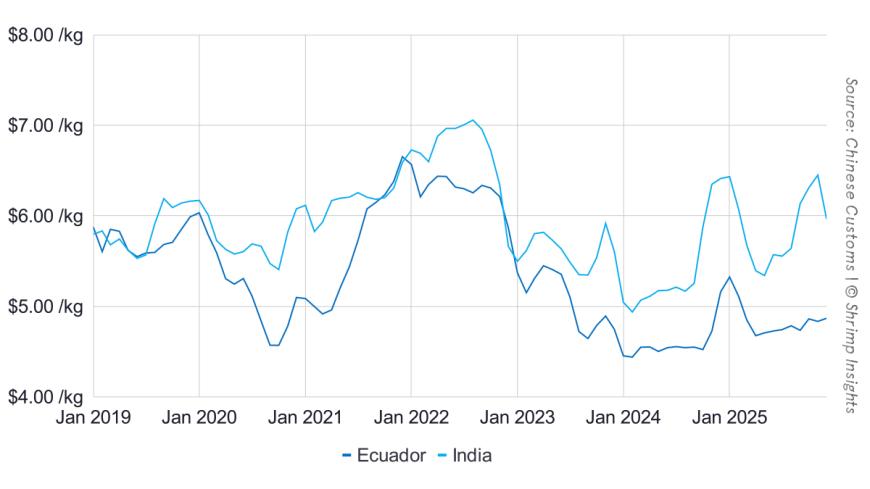
Ecuador remained the backbone of China’s shrimp supply but saw marginal erosion over the year, with December shipments down 20% YoY and full-year volumes at 651,866 MT (-3% YoY). India emerged as the key growth supplier in 2025, accelerating in the second half and closing the year with a strong December (+58% YoY), lifting full-year volumes to 149,599 MT (+6% YoY). Thailand recorded solid full-year growth (+19% YoY) despite a softer December (-4% YoY), while Argentina (+10% YoY) and Indonesia (+28% YoY) both expanded their footprint, supported by a strong December performance and continued diversification of China’s supplier base.
Byte in Numbers
Total Import
- Volume
- Jan: 69,814 MT = -28% YoY
- Feb: 62,167 MT = +3% YoY
- Mar: 67,642 MT = -8% YoY
- Apr: 70,067 MT = +5% YoY
- May: 74,097 MT = +6% YoY
- Jun: 85,901 MT = +9% YoY
- Jul: 90,683 MT = +10% YoY
- Aug: 85,498 MT = +5% YoY
- Sep: 66,757 MT = +1% YoY
- Oct: 70,133 MT = -0% YoY
- Nov: 76,396 MT = -3% YoY
- Dec: 82,409 MT = -9% YoY
- Year-Total: 901,563 MT = -2% YoY
- Value
- Jan: $398 million = -14% YoY
- Feb: $340 million = +21% YoY
- Mar: $351 million = -3% YoY
- Apr: $356 million = +6% YoY
- May: $376 million = +10% YoY
- Jun: $442 million = +17% YoY
- Jul: $464 million = +17% YoY
- Aug: $443 million = +12% YoY
- Sep: $358 million = +9% YoY
- Oct: $380 million = +8% YoY
- Nov: $428 million = +2% YoY
- Dec: $456 million = -9% YoY
- Year-Total: $4,794 million = +5% YoY
Top 5 Suppliers by Volume
- Ecuador
- Jan: 51,013 MT = -30% YoY
- Feb: 49,112 MT = +16% YoY
- Mar: 50,678 MT = -9% YoY
- Apr: 52,295 MT = +11% YoY
- May: 52,055 MT = +4% YoY
- Jun: 64,793 MT = +3% YoY
- Jul: 69,327 MT = +16% YoY
- Aug: 65,633 MT = +8% YoY
- Sep: 46,850 MT = -6% YoY
- Oct: 48,371 MT = -8% YoY
- Nov: 50,539 MT = -7% YoY
- Dec: 51,198 MT = -20% YoY
- Year-Total: 651,866 MT = -3% YoY
- India
- Jan: 10,105 MT = -21% YoY
- Feb: 5,909 MT = -37% YoY
- Mar: 7,093 MT = -19% YoY
- Apr: 10,080 MT = -11% YoY
- May: 14,088 MT = +12% YoY
- Jun: 14,522 MT = +28% YoY
- Jul: 14,570 MT = -7% YoY
- Aug: 10,357 MT = -20% YoY
- Sep: 13,877 MT = +46% YoY
- Oct: 13,937 MT = +56% YoY
- Nov: 14,623 MT = +2% YoY
- Dec: 20,437 MT = +58% YoY
- Year-Total: 149,599 MT = +6% YoY
- Thailand
- Jan: 1,916 MT = -24% YoY
- Feb: 1,205 MT = -10% YoY
- Mar: 2,015 MT = +15% YoY
- Apr: 2,065 MT = -23% YoY
- May: 2,024 MT = +26% YoY
- Jun: 2,440 MT = +73% YoY
- Jul: 2,294 MT = +125% YoY
- Aug: 2,584 MT = +30% YoY
- Sep: 2,784 MT = +59% YoY
- Oct: 2,148 MT = +1% YoY
- Nov: 3,477 MT = +62% YoY
- Dec: 2,787 MT = -4% YoY
- Year-Total: 27,739 MT = +19% YoY
- Argentina
- Jan: 575 MT = -45% YoY
- Feb: 2,964 MT = +476% YoY
- Mar: 2,429 MT = -4% YoY
- Apr: 2,243 MT = -12% YoY
- May: 1,350 MT = -9% YoY
- Jun: 1,798 MT = +247% YoY
- Jul: 1,113 MT = +137% YoY
- Aug: 630 MT = +2% YoY
- Sep: 570 MT = -60% YoY
- Oct: 879 MT = -53% YoY
- Nov: 2,546 MT = -22% YoY
- Dec: 2,075 MT = +78% YoY
- Year-Total: 19,170 MT = +10% YoY
- Indonesia
- Jan: 1,136 MT = +354% YoY
- Feb: 375 MT = -75% YoY
- Mar: 1,368 MT = +4% YoY
- Apr: 153 MT = -38% YoY
- May: 1,555 MT = +1,137% YoY
- Jun: 240 MT = -43% YoY
- Jul: 1,312 MT = +15% YoY
- Aug: 1,460 MT = +263% YoY
- Sep: 278 MT = -24% YoY
- Oct: 1,382 MT = +3% YoY
- Nov: 1,732 MT = +13% YoY
- Dec: 2,145 MT = +32% YoY
- Year-Total: 13,137 MT = +28% YoY