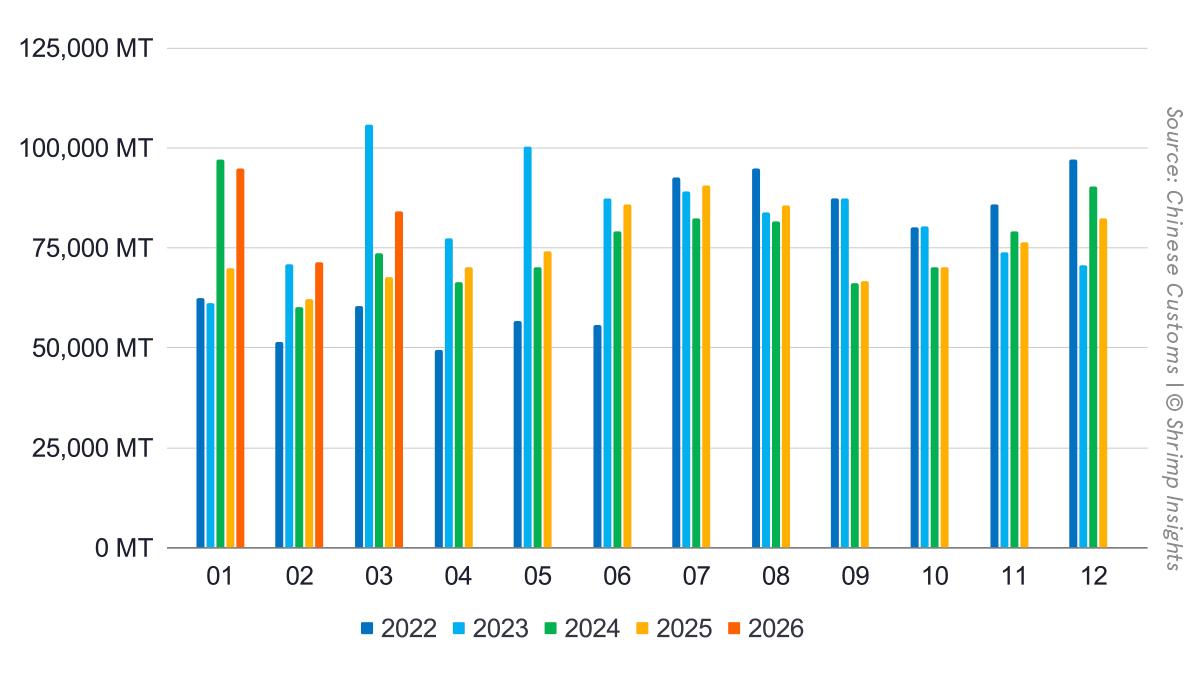

China’s shrimp imports rebounded strongly in the first quarter of 2026, reversing the softer trend seen toward the end of 2025. After contracting year-on-year in November (–3%) and December (–9%), imports accelerated sharply at the start of the year. January volumes reached 94,707 MT (+36% YoY), followed by 71,379 MT in February (+15%) and 84,105 MT in March (+24%). This brought Q1 imports to 250,192 MT, up 25% YoY.
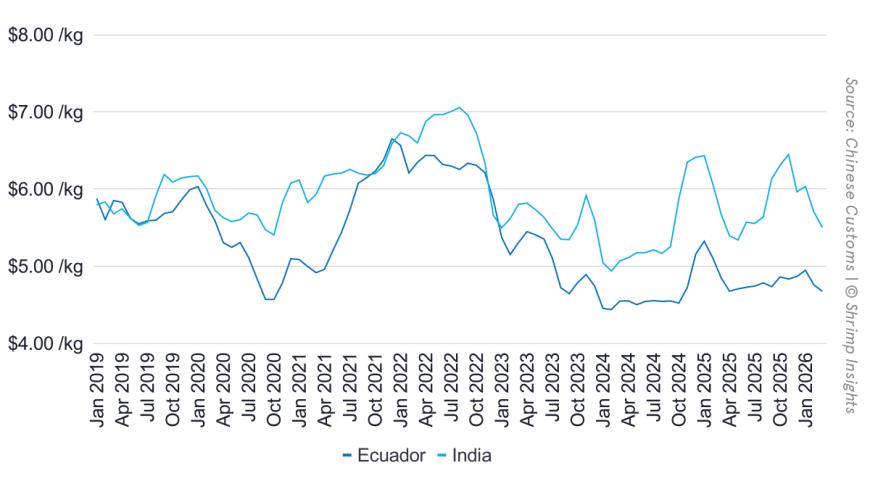
In value terms, imports grew to $505 million in January (+27%), $364 million in February (+7%), and $429 million in March (+22%), resulting in a Q1 total of $1.297 billion, up 19% YoY. The gap between volume and value growth suggests a continued shift toward lower average import prices and/or a higher share of lower-value product formats.
Suppliers
Ecuador remained the dominant supplier and the main driver of China’s import growth. Exports reached 73,358 MT in January (+44% YoY), 55,682 MT in February (+13%), and 63,561 MT in March (+25%), bringing Q1 shipments to 192,601 MT (+28% YoY). Ecuador accounted for roughly three quarters of China’s total imports in the quarter, reinforcing its structural dominance in this market.
India showed the strongest relative growth among major suppliers. Shipments reached 14,066 MT in January (+39% YoY), 8,486 MT in February (+44%), and 12,969 MT in March (+83%), pushing Q1 exports to 35,521 MT (+54% YoY). The sharp increase in March confirms India’s strengthening position as China’s second-largest supplier.
Thailand continued to expand steadily from a smaller base. Exports totaled 6,031 MT in Q1 (+17% YoY), with consistent monthly growth of +14% in January, +26% in February, and +16% in March, indicating stable but moderate expansion.
Argentina moved in the opposite direction. Despite a strong January (+44% YoY), imports dropped sharply in February (–71%) and remained down in March (–21%), bringing Q1 volumes to 3,612 MT (–39% YoY). This makes Argentina the weakest performer among the top suppliers.
Indonesia posted modest growth overall, with Q1 exports reaching 3,354 MT (+16% YoY), but monthly volumes remained volatile. January declined sharply (–56%), followed by a strong rebound in February (+293%) and flat performance in March (+1%), highlighting its inconsistent supply pattern into China.
Byte in Numbers
Total Import
- Volume
- Apr: 70,067 MT = +5% YoY
- May: 74,097 MT = +6% YoY
- Jun: 85,901 MT = +9% YoY
- Jul: 90,683 MT = +10% YoY
- Aug: 85,498 MT = +5% YoY
- Sep: 66,757 MT = +1% YoY
- Oct: 70,133 MT = -0% YoY
- Nov: 76,396 MT = -3% YoY
- Dec: 82,409 MT = -9% YoY
- 2025 Year-Total: 901,563 MT = -2% YoY
- Jan: 94,707 MT = +36% YoY
- Feb: 71,379 MT = +15% YoY
- Mar: 84,105 MT = +24% YoY
- 2026 YTD: 250,192 MT = +25% YoY
- Value
- Apr: $356 million = +6% YoY
- May: $376 million = +10% YoY
- Jun: $442 million = +17% YoY
- Jul: $464 million = +17% YoY
- Aug: $443 million = +12% YoY
- Sep: $358 million = +9% YoY
- Oct: $380 million = +8% YoY
- Nov: $428 million = +2% YoY
- Dec: $456 million = -9% YoY
- 2025 Year-Total: $4,794 million = +5% YoY
- Jan: $505 million = +27% YoY
- Feb: $364 million = +7% YoY
- Mar: $429 million = +22% YoY
- 2026 YTD: $1,297 million = +19% YoY
Top Five Suppliers by Volume
- Ecuador
- Apr: 52,295 MT = +11% YoY
- May: 52,055 MT = +4% YoY
- Jun: 64,793 MT = +3% YoY
- Jul: 69,327 MT = +16% YoY
- Aug: 65,633 MT = +8% YoY
- Sep: 46,850 MT = -6% YoY
- Oct: 48,371 MT = -8% YoY
- Nov: 50,539 MT = -7% YoY
- Dec: 51,198 MT = -20% YoY
- 2025 Year-Total: 651,866 MT = -3% YoY
- Jan: 73,358 MT = +44% YoY
- Feb: 55,682 MT = +13% YoY
- Mar: 63,561 MT = +25% YoY
- 2026 YTD: 192,601 MT = +28% YoY
- India
- Apr: 10,080 MT = -11% YoY
- May: 14,088 MT = +12% YoY
- Jun: 14,522 MT = +28% YoY
- Jul: 14,570 MT = -7% YoY
- Aug: 10,357 MT = -20% YoY
- Sep: 13,877 MT = +46% YoY
- Oct: 13,937 MT = +56% YoY
- Nov: 14,623 MT = +2% YoY
- Dec: 20,437 MT = +58% YoY
- 2025 Year-Total: 149,599 MT = +6% YoY
- Jan: 14,066 MT = +39% YoY
- Feb: 8,486 MT = +44% YoY
- Mar: 12,969 MT = +83% YoY
- 2026 YTD: 35,521 MT = +54% YoY
- Thailand
- Apr: 2,065 MT = -23% YoY
- May: 2,024 MT = +26% YoY
- Jun: 2,440 MT = +73% YoY
- Jul: 2,294 MT = +125% YoY
- Aug: 2,584 MT = +30% YoY
- Sep: 2,784 MT = +59% YoY
- Oct: 2,148 MT = +1% YoY
- Nov: 3,477 MT = +62% YoY
- Dec: 2,787 MT = -4% YoY
- 2025 Year-Total: 27,739 MT = +19% YoY
- Jan: 2,180 MT = +14% YoY
- Feb: 1,515 MT = +26% YoY
- Mar: 2,336 MT = +16% YoY
- 2026 YTD: 6,031 MT = +17% YoY
- Argentina
- Apr: 2,243 MT = -12% YoY
- May: 1,350 MT = -9% YoY
- Jun: 1,798 MT = +247% YoY
- Jul: 1,113 MT = +137% YoY
- Aug: 630 MT = +2% YoY
- Sep: 570 MT = -60% YoY
- Oct: 879 MT = -53% YoY
- Nov: 2,546 MT = -22% YoY
- Dec: 2,075 MT = +78% YoY
- 2025 Year-Total: 19,170 MT = +10% YoY
- Jan: 829 MT = +44% YoY
- Feb: 872 MT = -71% YoY
- Mar: 1,911 MT = -21% YoY
- 2026 YTD: 3,612 MT = -39% YoY
- Indonesia
- Apr: 153 MT = -38% YoY
- May: 1,555 MT = +1,137% YoY
- Jun: 240 MT = -43% YoY
- Jul: 1,312 MT = +15% YoY
- Aug: 1,460 MT = +263% YoY
- Sep: 278 MT = -24% YoY
- Oct: 1,382 MT = +3% YoY
- Nov: 1,732 MT = +13% YoY
- Dec: 2,145 MT = +32% YoY
- 2025 Year-Total: 13,137 MT = +28% YoY
- Jan: 501 MT = -56% YoY
- Feb: 1,477 MT = +293% YoY
- Mar: 1,377 MT = +1% YoY
- 2026 YTD: 3,354 MT = +16% YoY