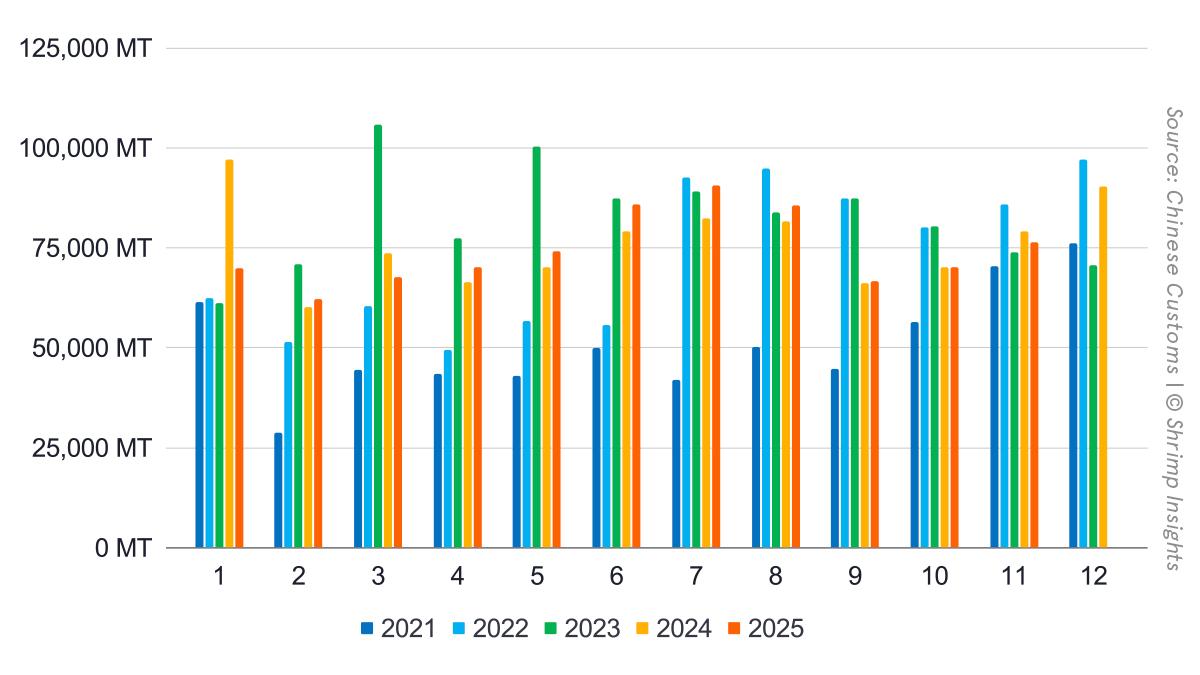
After a weak start to the year, China’s shrimp imports recovered through spring and summer before stabilising in the second half. January volumes were sharply lower year on year, but from April to August monthly imports consistently moved in the 70,000–90,000 MT range, indicating a clear normalisation of demand. Momentum eased again in September and October, with November showing only a modest rebound. Over the first eleven months, China imported 819,154 MT, 1% below last year, while import value reached $4.34 billion, up 7% year on year. November fits this pattern well: volumes declined slightly to 76,396 MT (-3% YoY), but value still increased to $428 million (+2% YoY), underlining continued price firmness despite cautious buying.
Supplier Dynamics
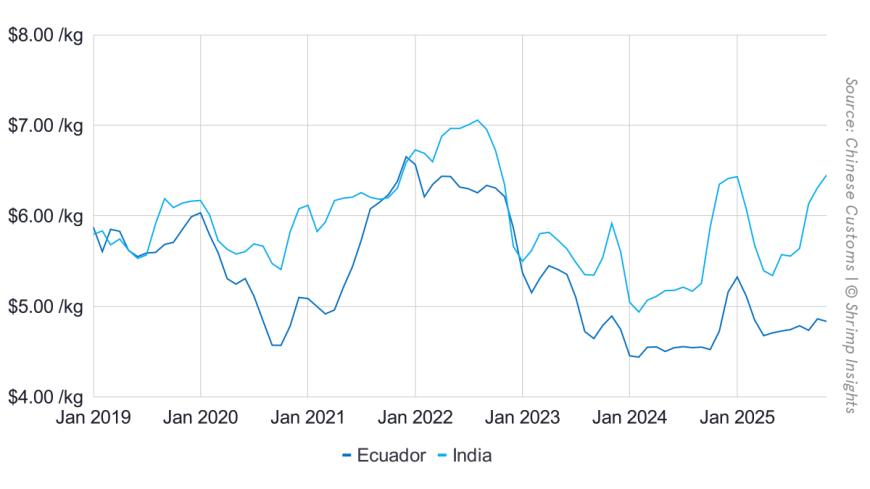
Ecuador remained by far the dominant supplier, accounting for the bulk of China’s imports, but volumes edged 1% lower year to date, with November shipments down 7% year on year, signalling some loss of momentum in the second half. India showed a contrasting trend, with a weak first quarter followed by a strong recovery from May onwards; by November, imports from India were slightly positive year to date, supported by very strong growth in September and October. Thailand emerged as the fastest-growing supplier, with volumes up 23% year to date and a particularly strong November, albeit from a much smaller base. Argentina and Indonesia both posted year-to-date growth, but with highly volatile monthly patterns, reflecting opportunistic rather than structurally expanding supply into the Chinese market.
Byte in Numbers
Total Import
- Volume
- Jan: 69,814 MT = -28% YoY
- Feb: 62,167 MT = +3% YoY
- Mar: 67,642 MT = -8% YoY
- Apr: 70,067 MT = +5% YoY
- May: 74,097 MT = +6% YoY
- Jun: 85,901 MT = +9% YoY
- Jul: 90,683 MT = +10% YoY
- Aug: 85,498 MT = +5% YoY
- Sep: 66,757 MT = +1% YoY
- Oct: 70,133 MT = -0% YoY
- Nov: 76,396 MT = -3% YoY
- YTD (Jan–Nov): 819,154 MT = -1% YoY
- Value
- Jan: $398 million = -14% YoY
- Feb: $340 million = +21% YoY
- Mar: $351 million = -3% YoY
- Apr: $356 million = +6% YoY
- May: $376 million = +10% YoY
- Jun: $442 million = +17% YoY
- Jul: $464 million = +17% YoY
- Aug: $443 million = +12% YoY
- Sep: $358 million = +9% YoY
- Oct: $380 million = +8% YoY
- Nov: $428 million = +2% YoY
- YTD (Jan–Nov): $4,338 million = +7% YoY
Top 5 Suppliers by Volume
- Ecuador
- Jan: 51,013 MT = -30% YoY
- Feb: 49,112 MT = +16% YoY
- Mar: 50,678 MT = -9% YoY
- Apr: 52,295 MT = +11% YoY
- May: 52,055 MT = +4% YoY
- Jun: 64,793 MT = +3% YoY
- Jul: 69,327 MT = +16% YoY
- Aug: 65,633 MT = +8% YoY
- Sep: 46,850 MT = -6% YoY
- Oct: 48,371 MT = -8% YoY
- Nov: 50,539 MT = -7% YoY
- YTD (Jan–Nov): 600,668 MT = -1% YoY
- India
- Jan: 10,105 MT = -21% YoY
- Feb: 5,909 MT = -37% YoY
- Mar: 7,093 MT = -19% YoY
- Apr: 10,080 MT = -11% YoY
- May: 14,088 MT = +12% YoY
- Jun: 14,522 MT = +28% YoY
- Jul: 14,570 MT = -7% YoY
- Aug: 10,357 MT = -20% YoY
- Sep: 13,877 MT = +46% YoY
- Oct: 13,937 MT = +56% YoY
- Nov: 14,623 MT = +2% YoY
- YTD (Jan–Nov): 129,162 MT = +1% YoY
- Thailand
- Jan: 1,916 MT = -24% YoY
- Feb: 1,205 MT = -10% YoY
- Mar: 2,015 MT = +15% YoY
- Apr: 2,065 MT = -23% YoY
- May: 2,024 MT = +26% YoY
- Jun: 2,440 MT = +73% YoY
- Jul: 2,294 MT = +125% YoY
- Aug: 2,584 MT = +30% YoY
- Sep: 2,784 MT = +59% YoY
- Oct: 2,148 MT = +1% YoY
- Nov: 3,477 MT = +62% YoY
- YTD (Jan–Nov): 24,952 MT = +23% YoY
- Argentina
- Jan: 575 MT = -45% YoY
- Feb: 2,964 MT = +476% YoY
- Mar: 2,429 MT = -4% YoY
- Apr: 2,243 MT = -12% YoY
- May: 1,350 MT = -9% YoY
- Jun: 1,798 MT = +247% YoY
- Jul: 1,113 MT = +137% YoY
- Aug: 630 MT = +2% YoY
- Sep: 570 MT = -60% YoY
- Oct: 879 MT = -53% YoY
- Nov: 2,546 MT = -22% YoY
- YTD (Jan–Nov): 17,095 MT = +5% YoY
- Indonesia
- Jan: 1,136 MT = +354% YoY
- Feb: 375 MT = -75% YoY
- Mar: 1,368 MT = +4% YoY
- Apr: 153 MT = -38% YoY
- May: 1,555 MT = +1,137% YoY
- Jun: 240 MT = -43% YoY
- Jul: 1,312 MT = +15% YoY
- Aug: 1,460 MT = +263% YoY
- Sep: 278 MT = -24% YoY
- Oct: 1,382 MT = +3% YoY
- Nov: 1,732 MT = +13% YoY
- YTD (Jan–Nov): 10,991 MT = +27% YoY