China’s monthly shrimp imports from January 2021 till April 2025
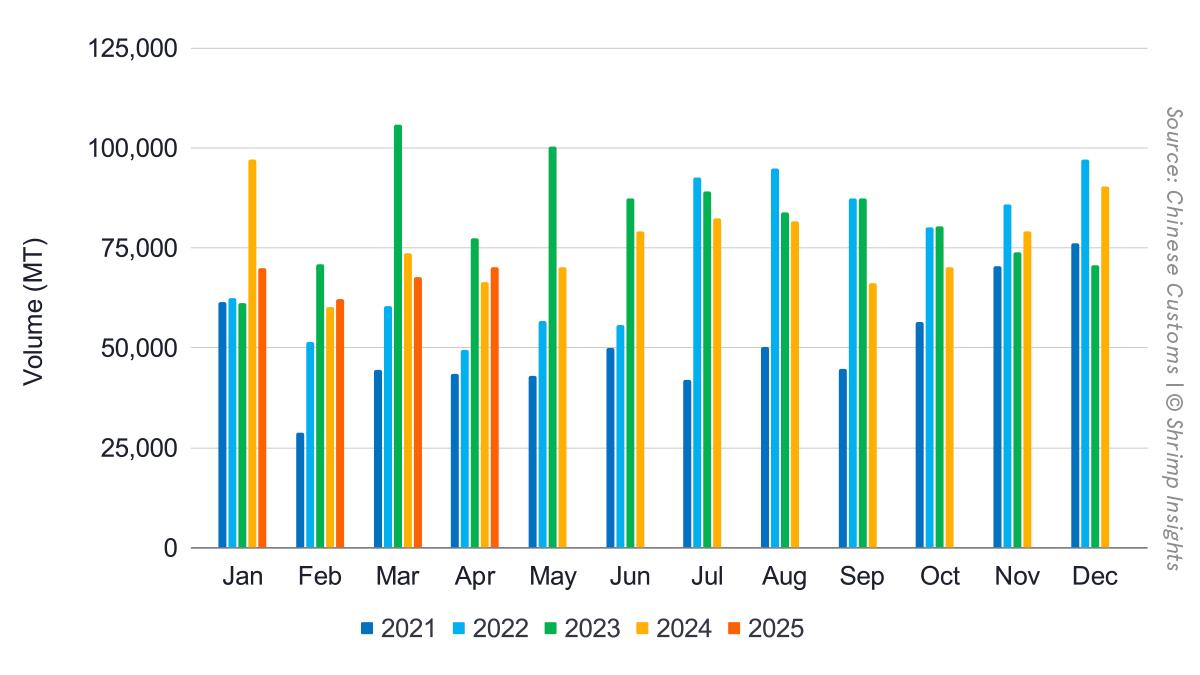
China’s shrimp imports in April reached 70,066 MT, a 5% year-over-year increase. However, the year-to-date is still 9% behind. The export increase in April is primarily accounted for by Ecuador, which shipped 11% more than in April 2024. April imports from India, Argentina, and Thailand fell year over year.
Total
- Volume
- Jan: 69,813.8 MT = -28% YoY
- Feb: 62,166.6 MT = +3% YoY
- Mar: 67,642.3 MT = -8% YoY
- Apr: 70,066.6 MT = +5% YoY
- YTD (Jan–Apr): 269,689.3 MT = -9% YoY
- Value
- Jan: 398.4 mln USD = -14% YoY
- Feb: 340.2 mln USD = +21% YoY
- Mar: 351.5 mln USD = -3% YoY
- Apr: 356.2 mln USD = +6% YoY
- YTD (Jan–Apr): 1,446.2 mln USD = +0% YoY
Top 5 Suppliers by Volume
- Ecuador
- Jan: 51,013 MT = -30% YoY
- Feb: 49,112 MT = +16% YoY
- Mar: 50,678 MT = -9% YoY
- Apr: 52,295 MT = +11% YoY
- YTD (Jan–Apr): 203,100 MT = -7% YoY
- India
- Jan: 10,105 MT = -21% YoY
- Feb: 5,909 MT = -37% YoY
- Mar: 7,093 MT = -19% YoY
- Apr: 10,080 MT = -11% YoY
- YTD (Jan–Apr): 33,187 MT = -22% YoY
- Argentina
- Jan: 575 MT = -45% YoY
- Feb: 2,964 MT = +476% YoY
- Mar: 2,429 MT = -4% YoY
- Apr: 2,243 MT = -12% YoY
- YTD (Jan–Apr): 8,211 MT = +24% YoY
- Thailand
- Jan: 1,916 MT = -24% YoY
- Feb: 1,205 MT = -10% YoY
- Mar: 2,015 MT = +15% YoY
- Apr: 2,065 MT = -23% YoY
- YTD (Jan–Apr): 7,201 MT = -13% YoY
- Venezuela
- Jan: 212 MT = -76% YoY
- Feb: 956 MT = +5% YoY
- Mar: 2,408 MT = +519% YoY
- Apr: 1,180 MT = +245% YoY
- YTD (Jan–Apr): 4,755 MT = +88% YoY
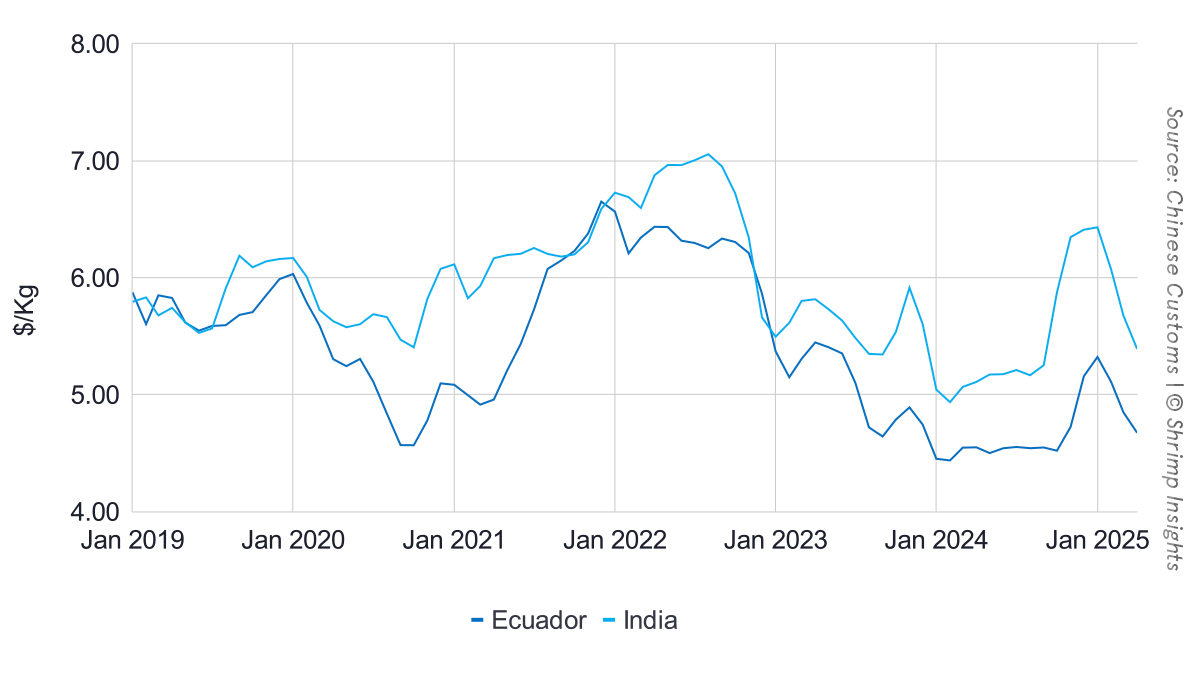
In terms of value, the import value reached $365 million in April, a 6% year-over-year increase. The year-total import value has reached $1.45 billion, the same amount as last year. Although average import values are still ahead year-over-year, over recent months, average import values have continued to decline.
Average import values from January 2019 till April 2025