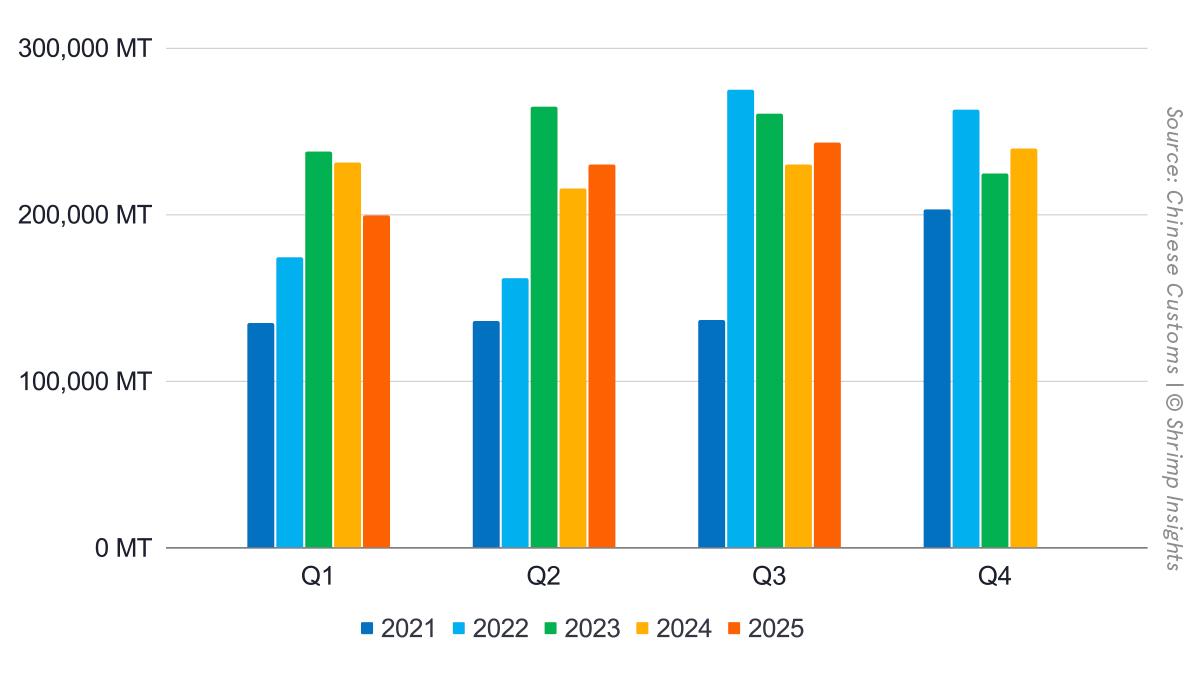
China’s shrimp imports in September 2025 held broadly stable, marking the tail end of a relatively steady third quarter. Total imports reached 66,757 MT, a slight 1 % increase year-on-year, bringing cumulative imports for the first nine months of the year to 672,625 MT, 1 % below the same period in 2024. In value terms, imports rose more consistently: $358 million in September (+9 % YoY), lifting the year-to-date import value to $3.53 billion, 8 % higher than last year. The data confirms a mixed picture: China’s import volumes have stagnated compared to 2024, but the total value has increased steadily, reflecting higher average prices and a greater share of premium-sized products.
Suppliers
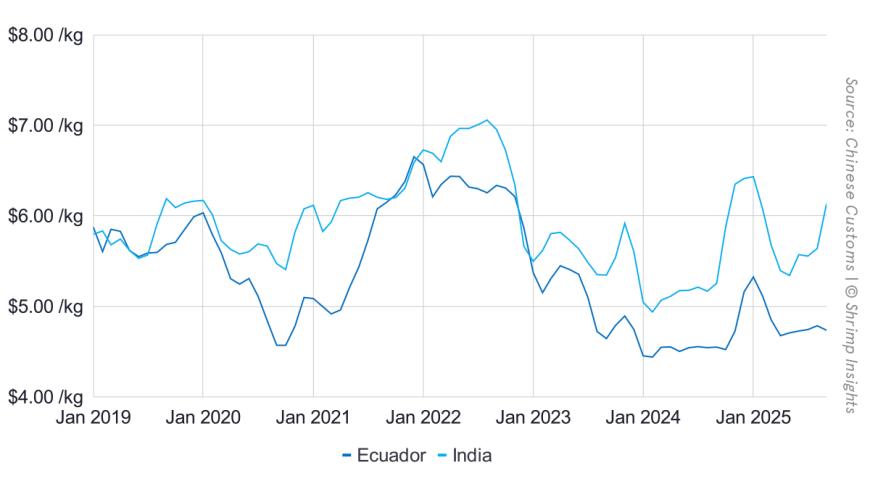
Ecuador, which continues to dominate the Chinese market, shipped 46,850 MT in September, down 6 % year-on-year. Its cumulative shipments for January–September stood at 501,757 MT, virtually unchanged from last year. Despite the recent decline, Ecuador still accounts for nearly three-quarters of China’s total shrimp imports.
India remains China’s distant second supplier, with 13,877 MT imported in September, a sharp 46 % increase from last year. The rebound in September followed several weaker months and brought India’s year-to-date shipments to 100,601 MT, 4 % lower than in 2024. Indian exporters have been redirecting more volumes toward China since U.S. tariffs on Indian shrimp took effect in late August, and this sudden 46 % rise likely reflects those early diversions.
Thailand continues to strengthen its position in the Chinese market. Imports from Thailand reached 2,784 MT in September, up 59 % year-on-year, and cumulative shipments for January–September climbed 20 % to 19,327 MT. Thai exporters have successfully targeted China with high-quality cooked and value-added products, particularly for foodservice and premium retail.
Argentina, primarily a supplier of Pleoticus muelleri red shrimp, saw imports drop to 570 MT, a sharp 60 % decrease, following several months of erratic performance. Still, cumulative imports are up 23 % year-to-date (13,671 MT), driven by earlier strong months.
Indonesia’s exports to China remain volatile but on an upward trend. September shipments stood at 278 MT, down 24 % year-on-year, but year-to-date totals reached 7,877 MT, 36 % higher than in 2024. Indonesia’s surge earlier in the year—especially in May and August—reflected opportunistic shipments of both vannamei and value-added products as exporters diversified away from the U.S. market.
Byte in Numbers
Total Import
- Volume
- Jan: 69,814 MT = -28% YoY
- Feb: 62,167 MT = +3% YoY
- Mar: 67,642 MT = -8% YoY
- Apr: 70,067 MT = +5% YoY
- May: 74,097 MT = +6% YoY
- Jun: 85,901 MT = +9% YoY
- Jul: 90,683 MT = +10% YoY
- Aug: 85,498 MT = +5% YoY
- Sep: 66,757 MT = +1% YoY
- YTD (Jan–Sep): 672,625 MT = -1% YoY
- Value
- Jan: $398 million = -14% YoY
- Feb: $340 million = +21% YoY
- Mar: $351 million = -3% YoY
- Apr: $356 million = +6% YoY
- May: $376 million = +10% YoY
- Jun: $442 million = +17% YoY
- Jul: $464 million = +17% YoY
- Aug: $443 million = +12% YoY
- Sep: $358 million = +9% YoY
- YTD (Jan–Sep): $3,529 million = +8% YoY
Top 5 Suppliers by Volume
- Ecuador
- Jan: 51,013 MT = -30% YoY
- Feb: 49,112 MT = +16% YoY
- Mar: 50,678 MT = -9% YoY
- Apr: 52,295 MT = +11% YoY
- May: 52,055 MT = +4% YoY
- Jun: 64,793 MT = +3% YoY
- Jul: 69,327 MT = +16% YoY
- Aug: 65,633 MT = +8% YoY
- Sep: 46,850 MT = -6% YoY
- YTD (Jan–Sep): 501,757 MT = 0% YoY
- India
- Jan: 10,105 MT = -21% YoY
- Feb: 5,909 MT = -37% YoY
- Mar: 7,093 MT = -19% YoY
- Apr: 10,080 MT = -11% YoY
- May: 14,088 MT = +12% YoY
- Jun: 14,522 MT = +28% YoY
- Jul: 14,570 MT = -7% YoY
- Aug: 10,357 MT = -20% YoY
- Sep: 13,877 MT = +46% YoY
- YTD (Jan–Sep): 100,601 MT = -4% YoY
- Thailand
- Jan: 1,916 MT = -24% YoY
- Feb: 1,205 MT = -10% YoY
- Mar: 2,015 MT = +15% YoY
- Apr: 2,065 MT = -23% YoY
- May: 2,024 MT = +26% YoY
- Jun: 2,440 MT = +73% YoY
- Jul: 2,294 MT = +125% YoY
- Aug: 2,584 MT = +30% YoY
- Sep: 2,784 MT = +59% YoY
- YTD (Jan–Sep): 19,327 MT = +20% YoY
- Argentina
- Jan: 575 MT = -45% YoY
- Feb: 2,964 MT = +476% YoY
- Mar: 2,429 MT = -4% YoY
- Apr: 2,243 MT = -12% YoY
- May: 1,350 MT = -9% YoY
- Jun: 1,798 MT = +247% YoY
- Jul: 1,113 MT = +137% YoY
- Aug: 630 MT = +2% YoY
- Sep: 570 MT = -60% YoY
- YTD (Jan–Sep): 13,671 MT = +23% YoY
- Indonesia
- Jan: 1,136 MT = +354% YoY
- Feb: 375 MT = -75% YoY
- Mar: 1,368 MT = +4% YoY
- Apr: 153 MT = -38% YoY
- May: 1,555 MT = +1,137% YoY
- Jun: 240 MT = -43% YoY
- Jul: 1,312 MT = +15% YoY
- Aug: 1,460 MT = +263% YoY
- Sep: 278 MT = -24% YoY
- YTD (Jan–Sep): 7,877 MT = +36% YoY