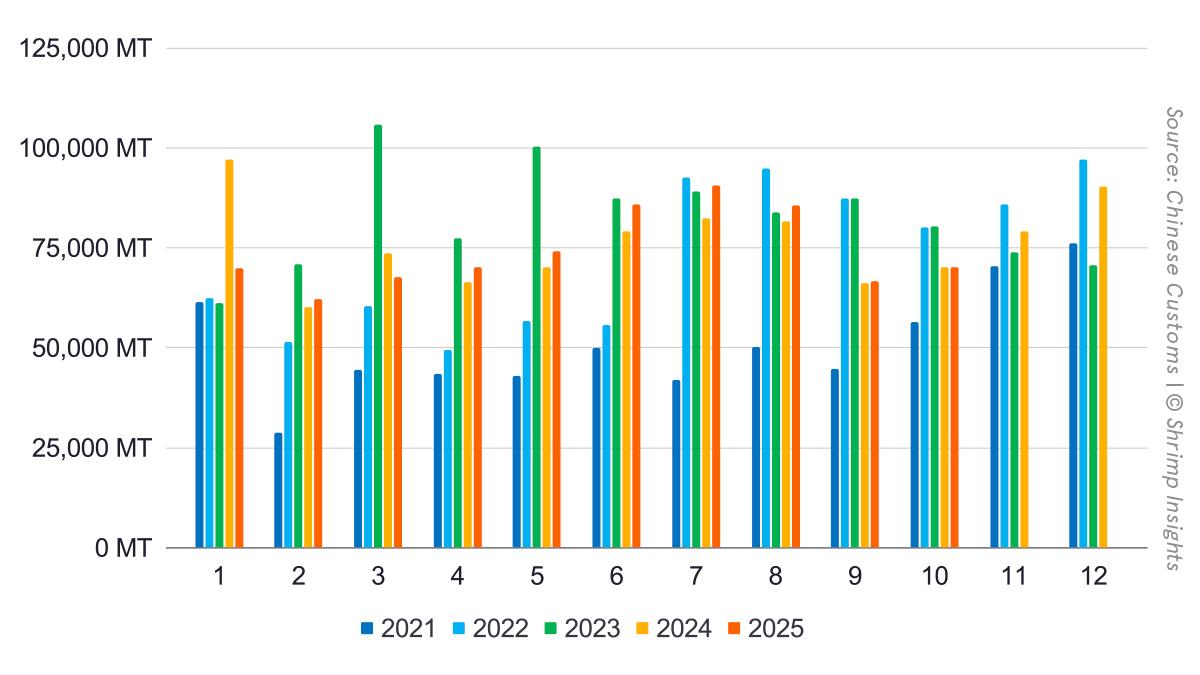
China’s shrimp import volumes for January–October reached 742,758 MT, almost matching last year’s level (-1% YoY) after a sharp contraction in January was gradually offset by steady growth from February through August. Monthly imports peaked in July at 90,683 MT (+10% YoY) before easing to +1% in September and flattening completely in October. In value terms, however, imports remained clearly ahead of last year, rising 8% YoY to $3.91 billion, with consistent double-digit gains from February through October reflecting firmer average prices or a shift toward higher-value products.
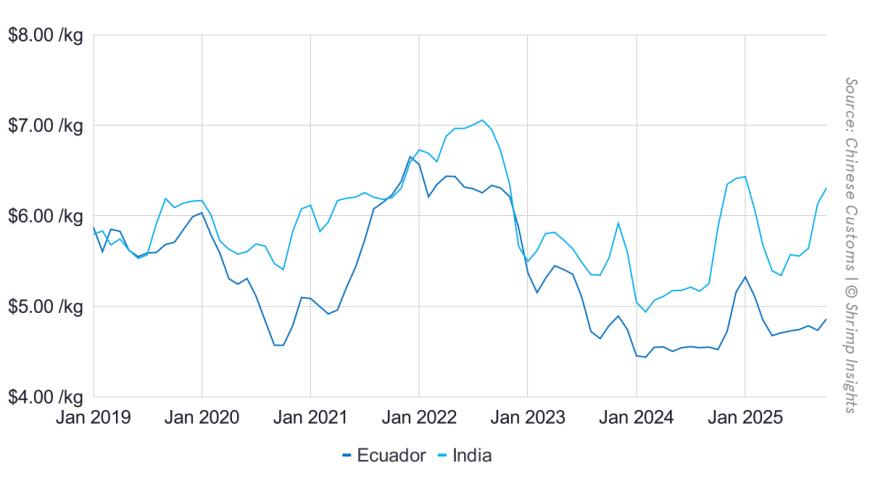
Ecuador continued to dominate China’s supply, delivering 550,128 MT YTD—virtually unchanged from last year (-1% YoY). Its shipments grew solidly through mid-year but slipped below 2024 levels in September and October. India, after a difficult start to the year, recovered strongly and closed the 10-month period slightly ahead (+1% YoY), driven by sizable rebounds in September (+46%) and October (+56%). Thailand remained a smaller but increasingly dynamic supplier (+18% YTD) with particularly strong growth from June onward. Argentina ended the period with a 12% YoY increase despite volatile month-to-month performance. Indonesia grew 30% YTD on the back of irregular but occasionally very large monthly volumes.
Byte in Numbers
Total Import
- Volume
- Jan: 69,814 MT = -28% YoY
- Feb: 62,167 MT = +3% YoY
- Mar: 67,642 MT = -8% YoY
- Apr: 70,067 MT = +5% YoY
- May: 74,097 MT = +6% YoY
- Jun: 85,901 MT = +9% YoY
- Jul: 90,683 MT = +10% YoY
- Aug: 85,498 MT = +5% YoY
- Sep: 66,757 MT = +1% YoY
- Oct: 70,133 MT = -0% YoY
- YTD (Jan–Oct): 742,758 MT = -1% YoY
- Value
- Jan: $398 million = -14% YoY
- Feb: $340 million = +21% YoY
- Mar: $351 million = -3% YoY
- Apr: $356 million = +6% YoY
- May: $376 million = +10% YoY
- Jun: $442 million = +17% YoY
- Jul: $464 million = +17% YoY
- Aug: $443 million = +12% YoY
- Sep: $358 million = +9% YoY
- Oct: $380 million = +8% YoY
- YTD (Jan–Oct): $3,910 million = +8% YoY
Top 5 Suppliers by Volume
- Ecuador
- Jan: 51,013 MT = -30% YoY
- Feb: 49,112 MT = +16% YoY
- Mar: 50,678 MT = -9% YoY
- Apr: 52,295 MT = +11% YoY
- May: 52,055 MT = +4% YoY
- Jun: 64,793 MT = +3% YoY
- Jul: 69,327 MT = +16% YoY
- Aug: 65,633 MT = +8% YoY
- Sep: 46,850 MT = -6% YoY
- Oct: 48,371 MT = -8% YoY
- YTD (Jan–Oct): 550,128 MT = -1% YoY
- India
- Jan: 10,105 MT = -21% YoY
- Feb: 5,909 MT = -37% YoY
- Mar: 7,093 MT = -19% YoY
- Apr: 10,080 MT = -11% YoY
- May: 14,088 MT = +12% YoY
- Jun: 14,522 MT = +28% YoY
- Jul: 14,570 MT = -7% YoY
- Aug: 10,357 MT = -20% YoY
- Sep: 13,877 MT = +46% YoY
- Oct: 13,937 MT = +56% YoY
- YTD (Jan–Oct): 114,539 MT = +1% YoY
- Thailand
- Jan: 1,916 MT = -24% YoY
- Feb: 1,205 MT = -10% YoY
- Mar: 2,015 MT = +15% YoY
- Apr: 2,065 MT = -23% YoY
- May: 2,024 MT = +26% YoY
- Jun: 2,440 MT = +73% YoY
- Jul: 2,294 MT = +125% YoY
- Aug: 2,584 MT = +30% YoY
- Sep: 2,784 MT = +59% YoY
- Oct: 2,148 MT = +1% YoY
- YTD (Jan–Oct): 21,474 MT = +18% YoY
- Argentina
- Jan: 575 MT = -45% YoY
- Feb: 2,964 MT = +476% YoY
- Mar: 2,429 MT = -4% YoY
- Apr: 2,243 MT = -12% YoY
- May: 1,350 MT = -9% YoY
- Jun: 1,798 MT = +247% YoY
- Jul: 1,113 MT = +137% YoY
- Aug: 630 MT = +2% YoY
- Sep: 570 MT = -60% YoY
- Oct: 879 MT = -53% YoY
- YTD (Jan–Oct): 14,549 MT = +12% YoY
- Indonesia
- Jan: 1,136 MT = +354% YoY
- Feb: 375 MT = -75% YoY
- Mar: 1,368 MT = +4% YoY
- Apr: 153 MT = -38% YoY
- May: 1,555 MT = +1,137% YoY
- Jun: 240 MT = -43% YoY
- Jul: 1,312 MT = +15% YoY
- Aug: 1,460 MT = +263% YoY
- Sep: 278 MT = -24% YoY
- Oct: 1,382 MT = +3% YoY
- YTD (Jan–Oct): 9,259 MT = +30% YoY