Totals
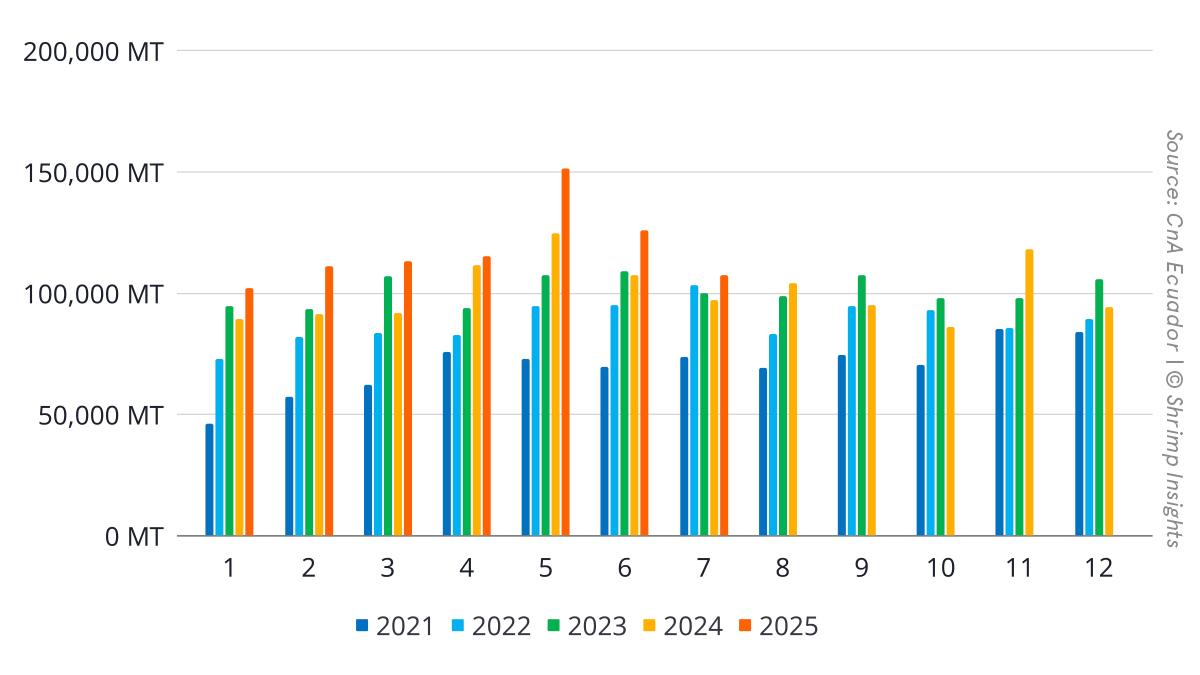
Ecuador exported 107,423 MT of shrimp in July, a 10% increase compared to the same month last year. Export value grew even faster, up 18% to $568 million. While July volumes were lower than the exceptional peak of May, the overall trend remains strong. Year-to-date shipments now total 826,577 MT, 16% higher than in 2024, with value reaching $4.36 billion, up 25%. This reflects not only robust demand but also the benefit of higher average prices compared to last year.
Markets
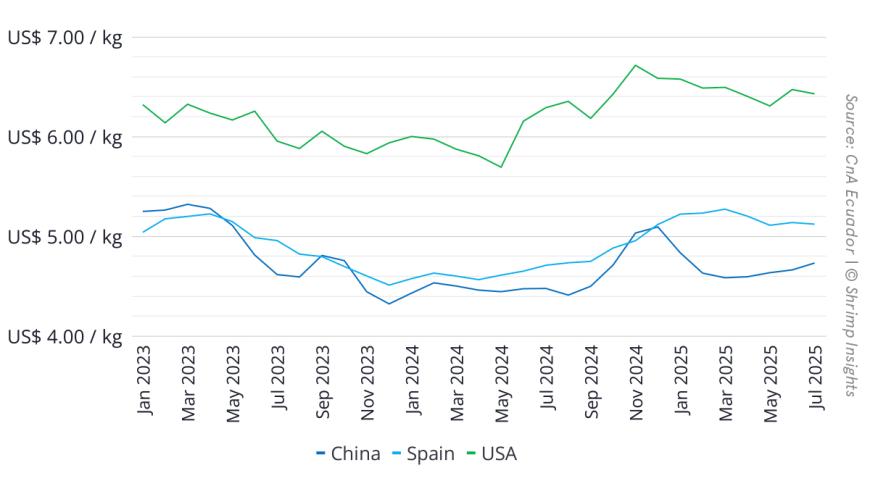
China remained Ecuador’s largest market in July with 54,294 MT, up 9% year-on-year, keeping year-to-date exports to China 8% higher at over 412,000 MT. The EU continued its rapid expansion, taking 22,732 MT in July, a 13% gain that brings cumulative exports 34% higher than last year. The US absorbed 17,031 MT in July, up 14%, pushing year-to-date exports to 151,432 MT, a 13% increase. Russia saw a sharp decline in July, down 40% year-on-year to 1,763 MT, though cumulative shipments remain slightly positive. Japan maintained its upward trajectory with 1,605 MT in July, 15% higher than last year, adding to a striking 48% year-to-date increase.
Byte in Numbers
Total Export
- Volume
- Jan: 102,145 MT = +14% YoY
- Feb: 111,027 MT = +21% YoY
- Mar: 113,240 MT = +23% YoY
- Apr: 115,145 MT = +3% YoY
- May: 151,521 MT = +21% YoY
- Jun: 126,074 MT = +18% YoY
- Jul: 107,423 MT = +10% YoY
- YTD (Jan–Jul): 826,577 MT = +16% YoY
- Value
- Jan: $545 million = +26% YoY
- Feb: $589 million = +30% YoY
- Mar: $610 million = +33% YoY
- Apr: $606 million = +12% YoY
- May: $785 million = +30% YoY
- Jun: $659 million = +26% YoY
- Jul: $568 million = +18% YoY
- YTD (Jan–Jul): $4,362 million = +25% YoY
Top Markets
- China
- Jan: 58,191 MT = +15% YoY
- Feb: 51,927 MT = +11% YoY
- Mar: 46,986 MT = +14% YoY
- Apr: 53,013 MT = -15% YoY
- May: 82,305 MT = +18% YoY
- Jun: 65,855 MT = +6% YoY
- Jul: 54,294 MT = +9% YoY
- YTD (Jan–Jul): 412,570 MT = +8% YoY
- EU
- Jan: 15,059 MT = +16% YoY
- Feb: 22,224 MT = +56% YoY
- Mar: 23,722 MT = +56% YoY
- Apr: 24,352 MT = +36% YoY
- May: 26,214 MT = +37% YoY
- Jun: 23,061 MT = +32% YoY
- Jul: 22,732 MT = +13% YoY
- YTD (Jan–Jul): 157,364 MT = +34% YoY
- USA
- Jan: 18,968 MT = +14% YoY
- Feb: 20,717 MT = +5% YoY
- Mar: 25,280 MT = -1% YoY
- Apr: 21,461 MT = +17% YoY
- May: 26,587 MT = +12% YoY
- Jun: 21,388 MT = +44% YoY
- Jul: 17,031 MT = +14% YoY
- YTD (Jan–Jul): 151,432 MT = +13% YoY
- Russia
- Jan: 1,110 MT = -30% YoY
- Feb: 1,595 MT = -35% YoY
- Mar: 2,206 MT = +6% YoY
- Apr: 3,120 MT = +16% YoY
- May: 2,020 MT = +3% YoY
- Jun: 3,958 MT = +153% YoY
- Jul: 1,763 MT = -40% YoY
- YTD (Jan–Jul): 15,772 MT = +3% YoY
- Japan
- Jan: 925 MT = +36% YoY
- Feb: 1,949 MT = +113% YoY
- Mar: 1,629 MT = +107% YoY
- Apr: 1,351 MT = +1% YoY
- May: 2,179 MT = +54% YoY
- Jun: 1,652 MT = +48% YoY
- Jul: 1,605 MT = +15% YoY
- YTD (Jan–Jul): 11,290 MT = +48% YoY