Total Exports
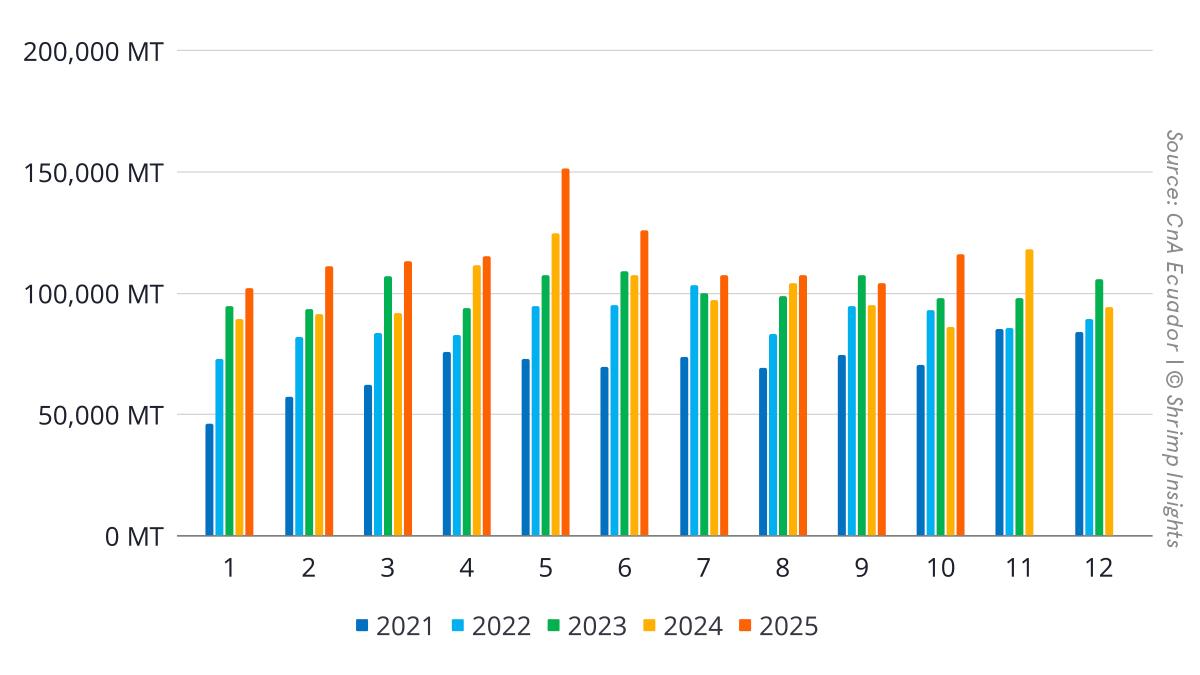
Ecuador’s shrimp exports accelerated sharply in October, bringing the year firmly back onto a robust growth path. Shipments reached 116,109 MT in October, a 35% year-on-year increase and the strongest monthly performance since May. This lifted total January–October exports to 1,154,317 MT, up 16% year-on-year. Export value followed a similar trajectory: October reached USD 650 million, up 48% year-on-year, while year-to-date value climbed to USD 6.16 billion, 25% higher than the same period last year. After a more moderate third quarter, October’s rebound signals renewed momentum in both volumes and prices.
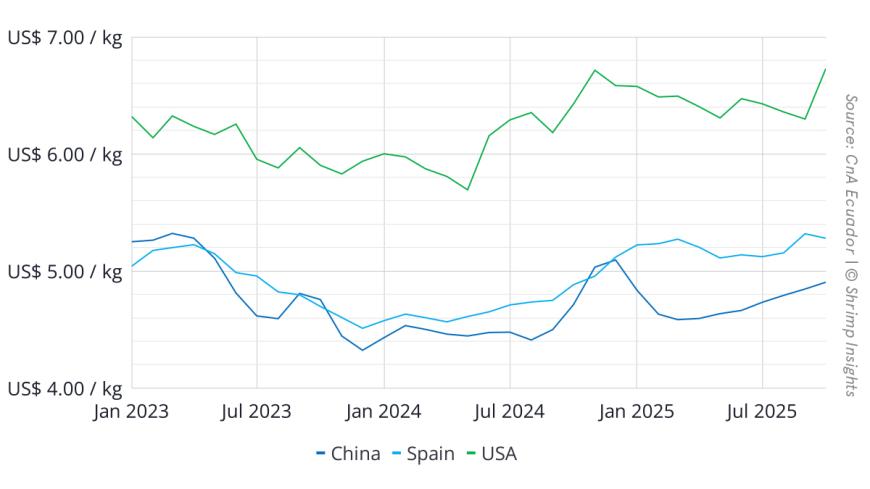
China
Exports to China improved in October after three months of contraction. Shipments reached 50,722 MT, 12% higher year-on-year. Despite the October recovery, China’s year-to-date imports from Ecuador totaled 556,190 MT, only 4% above last year. This reflects a year marked by fluctuations: strong growth early in the year, declines from August to September, and a moderate recovery in October.
European Union
The EU remained one of Ecuador’s most consistently growing markets throughout the year. October imports were 24,412 MT, up 41% year-on-year, maintaining the strong double-digit pace seen since February. Year-to-date shipments reached 227,337 MT, 34% higher than last year. The EU’s steady demand has made it a key contributor to Ecuador’s overall export expansion.
United States
The US market delivered the most striking growth in October. Imports more than doubled to 27,423 MT, a 105% year-on-year increase, following strong growth in September as well. This pushed January–October volumes to 224,217 MT, up 26% year-on-year. The second half of the year marks a clear turnaround for the US, which shifted from mixed results earlier in the year to exceptional growth in the past two months.
Russia
Exports to Russia continued to decline in October, totaling 1,750 MT, a 28% year-on-year decrease. This followed a pattern of generally lower shipments since July. Year-to-date exports reached 20,844 MT, still 14% below last year, despite isolated months of stronger performance earlier in the year.
Japan
Japan remained a consistently strong and fast-growing destination. October imports were 1,743 MT, up 83% year-on-year, maintaining the upward trend seen throughout the year except for August. Shipments reached 16,236 MT in the January–October period, up 43% year-on-year. Japan stands out as one of Ecuador’s most reliable growth markets in 2024.
Byte in Numbers
Total Export
- Volume
- Jan: 102,145 MT = +14% YoY
- Feb: 111,027 MT = +21% YoY
- Mar: 113,240 MT = +23% YoY
- Apr: 115,145 MT = +3% YoY
- May: 151,521 MT = +21% YoY
- Jun: 126,074 MT = +18% YoY
- Jul: 107,423 MT = +10% YoY
- Aug: 107,430 MT = +3% YoY
- Sep: 104,201 MT = +9% YoY
- Oct: 116,109 MT = +35% YoY
- YTD (Jan–Oct): 1,154,317 MT = +16% YoY
- Value
- Jan: $545 million = +26% YoY
- Feb: $589 million = +30% YoY
- Mar: $610 million = +33% YoY
- Apr: $606 million = +12% YoY
- May: $785 million = +30% YoY
- Jun: $659 million = +26% YoY
- Jul: $568 million = +18% YoY
- Aug: $581 million = +13% YoY
- Sep: $571 million = +22% YoY
- Oct: $650 million = +48% YoY
- YTD (Jan–Oct): $6,164 million = +25% YoY
Top Markets
- China
- Jan: 58,191 MT = +15% YoY
- Feb: 51,927 MT = +11% YoY
- Mar: 46,986 MT = +14% YoY
- Apr: 53,013 MT = -15% YoY
- May: 82,305 MT = +18% YoY
- Jun: 65,855 MT = +6% YoY
- Jul: 54,294 MT = +9% YoY
- Aug: 48,412 MT = -15% YoY
- Sep: 44,486 MT = -13% YoY
- Oct: 50,722 MT = +12% YoY
- YTD (Jan–Oct): 556,190 MT = +4% YoY
- EU
- Jan: 15,059 MT = +16% YoY
- Feb: 22,224 MT = +56% YoY
- Mar: 23,722 MT = +56% YoY
- Apr: 24,352 MT = +36% YoY
- May: 26,214 MT = +37% YoY
- Jun: 23,061 MT = +32% YoY
- Jul: 22,732 MT = +13% YoY
- Aug: 23,281 MT = +30% YoY
- Sep: 22,280 MT = +29% YoY
- Oct: 24,412 MT = +41% YoY
- YTD (Jan–Oct): 227,337 MT = +34% YoY
- USA
- Jan: 18,968 MT = +14% YoY
- Feb: 20,717 MT = +5% YoY
- Mar: 25,280 MT = -1% YoY
- Apr: 21,461 MT = +17% YoY
- May: 26,587 MT = +12% YoY
- Jun: 21,388 MT = +44% YoY
- Jul: 17,031 MT = +14% YoY
- Aug: 21,004 MT = +22% YoY
- Sep: 24,358 MT = +71% YoY
- Oct: 27,423 MT = +105% YoY
- YTD (Jan–Oct): 224,217 MT = +26% YoY
- Russia
- Jan: 1,110 MT = -30% YoY
- Feb: 1,595 MT = -35% YoY
- Mar: 2,206 MT = +6% YoY
- Apr: 3,120 MT = +16% YoY
- May: 2,020 MT = +3% YoY
- Jun: 3,958 MT = +153% YoY
- Jul: 1,763 MT = -40% YoY
- Aug: 1,698 MT = -47% YoY
- Sep: 1,624 MT = -50% YoY
- Oct: 1,750 MT = -28% YoY
- YTD (Jan–Oct): 20,844 MT = -14% YoY
- Japan
- Jan: 925 MT = +36% YoY
- Feb: 1,949 MT = +113% YoY
- Mar: 1,629 MT = +107% YoY
- Apr: 1,351 MT = +1% YoY
- May: 2,179 MT = +54% YoY
- Jun: 1,652 MT = +48% YoY
- Jul: 1,605 MT = +15% YoY
- Aug: 1,603 MT = 0% YoY
- Sep: 1,600 MT = +36% YoY
- Oct: 1,743 MT = +83% YoY
- YTD (Jan–Oct): 16,236 MT = +43% YoY