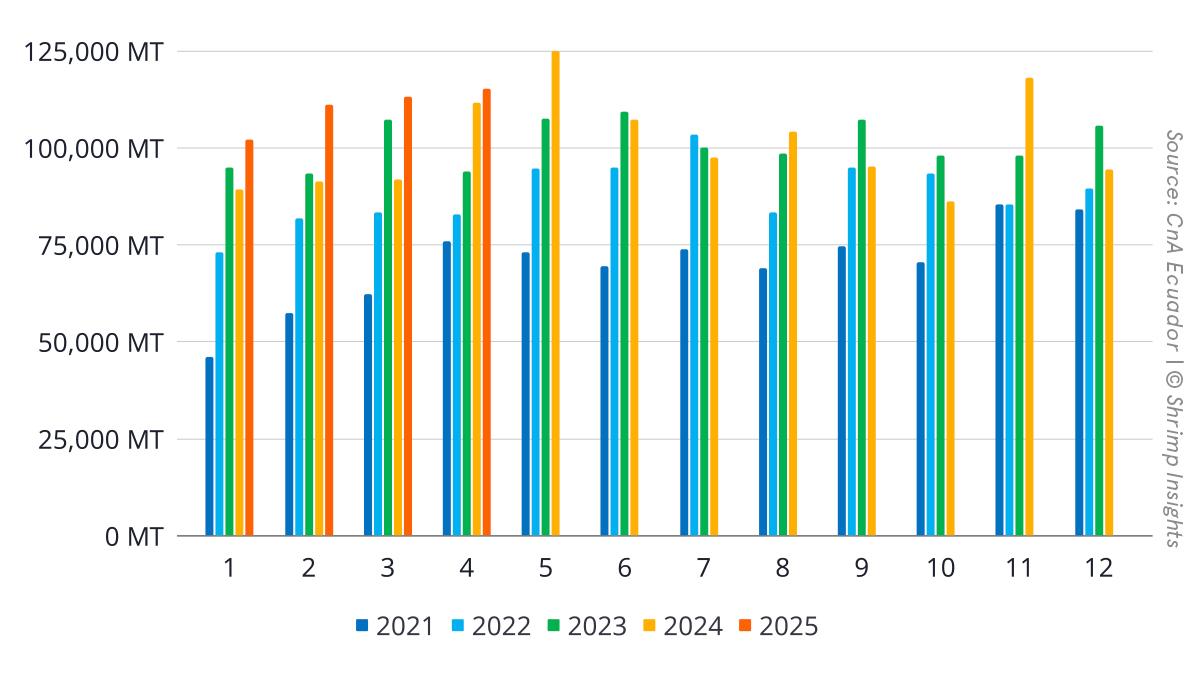
In April 2025, Ecuador exported 115,145 MT of shrimp, marking a 3% year-over-year increase. Export value reached $606 million—up 12%—reflecting stronger average prices compared to the same period last year. Cumulatively, exports for the first four months of the year reached 441,558 MT worth $2.4 billion, representing a 15% increase in volume and a 25% increase in value compared to the same period in 2024.
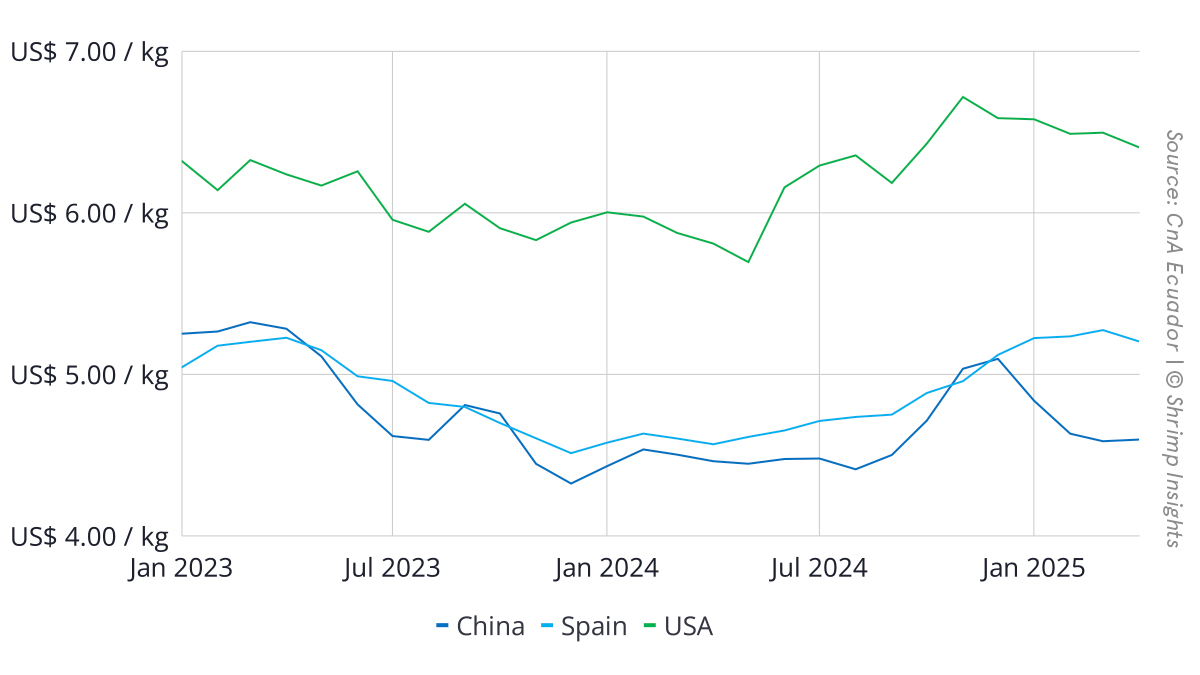
While average export values remain above last year’s level, recent months have shown a typical seasonal decline in price levels.
China’s imports from Ecuador dropped by 15% year-over-year in April. However, this was more than offset by significant increases to other markets: the US (+17%), the EU (+36%), Russia (+16%), and Vietnam (+46%). Once again, Ecuador has demonstrated its ability to pivot to alternative markets when Chinese demand weakens.
Examining year-to-date figures, exports to Vietnam have surged by 123%, likely driven by reprocessing activities, as Vietnamese processors import HLSO blocks to produce value-added products for re-export. Exports to the EU have also increased significantly (+41%), while growth in the US (+8%) and China (+4%) has been more modest. Shipments to Russia remain below 2024 levels.
Totals
- Volume
- Jan: 102,145 MT = +14% YoY
- Feb: 111,027 MT = +21% YoY
- Mar: 113,240 MT = +23% YoY
- Apr: 115,145 MT = +3% YoY
- YTD (Jan–Apr): 441,558 MT = +15% YoY
- Value
- Jan: $545 million = +26% YoY
- Feb: $589 million = +30% YoY
- Mar: $610 million = +33% YoY
- Apr: $606 million = +12% YoY
- YTD (Jan–Apr): $2,349 million = +25% YoY
Markets
- China
- Jan: 58,191 MT = +15% YoY
- Feb: 51,927 MT = +11% YoY
- Mar: 46,986 MT = +14% YoY
- Apr: 53,013 MT = -15% YoY
- YTD (Jan–Apr): 210,117 MT = +4% YoY
- US
- Jan: 18,968 MT = +14% YoY
- Feb: 20,717 MT = +5% YoY
- Mar: 25,280 MT = -1% YoY
- Apr: 21,461 MT = +17% YoY
- YTD (Jan–Apr): 86,426 MT = +8% YoY
- EU
- Jan: 15,059 MT = +16% YoY
- Feb: 22,224 MT = +56% YoY
- Mar: 23,722 MT = +56% YoY
- Apr: 24,352 MT = +36% YoY
- YTD (Jan–Apr): 85,357 MT = +41% YoY
- Russia
- Jan: 1,110 MT = -30% YoY
- Feb: 1,595 MT = -35% YoY
- Mar: 2,206 MT = +6% YoY
- Apr: 3,120 MT = +16% YoY
- YTD (Jan–Apr): 8,031 MT = -9% YoY
- Vietnam
- Jan: 1,682 MT = +136% YoY
- Feb: 1,222 MT = +44% YoY
- Mar: 2,085 MT = +397% YoY
- Apr: 1,114 MT = +46% YoY
- YTD (Jan–Apr): 6,103 MT = +123% YoY