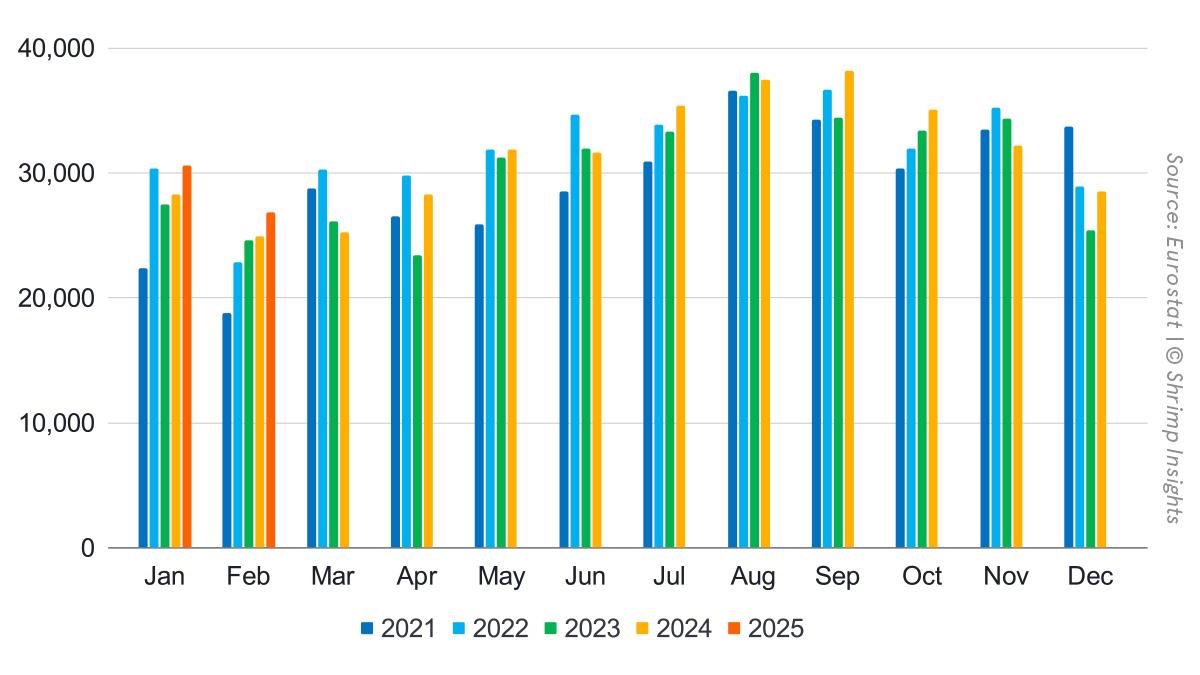
EU imports of HS 03061792 and HS 160521/29 from Asia, Latin America, and Africa continue to rise. In January and February, imports reached 30,604 metric tons (MT) and 26,849 MT, respectively, up 8% year-over-year each. While the Southern EU is ahead by 5% of last year, the Northwestern part is 15% ahead. The Eastern part of the EU is 10% behind. In terms of products, imports of raw frozen increased by 4% year over year, but imports of value-added products increased much faster, by 35%. The top three suppliers to the EU all increased their exports, Ecuador by 12%, India by 38%, and Vietnam by 12%. India is likely to replace a lot of Venezuela’s market share (supplies this year dropped by 51% year-over-year).
Total Raw Frozen Penaeus (HS 03061792) and Value-Added (HS 160521, 160529)
- Volume:
- Jan: 30,604.1 MT = +8% YoY
- Feb: 26,849.2 MT = +8% YoY
- Jan-Feb: 57,453.2 MT = +8% YoY
- Value:
- Jan: 212.4 mln EUR = +26% YoY
- Feb: 184.0 mln EUR = +21% YoY
- Jan-Feb: 396.4 mln EUR = +23% YoY
Import Regions of Raw Frozen Penaeus (HS 03061792) and Value-Added (HS 160521, 160529)
- Southern EU
- Jan: 15,997.8 MT = -4% YoY
- Feb: 16,251.9 MT = +15% YoY
- Jan-Feb: 32,249.7 MT = +5% YoY
- Northwestern EU
- Jan: 13,649.5 MT = +30% YoY
- Feb: 9,818.6 MT = -2% YoY
- Jan-Feb: 23,468.1 MT = +15% YoY
- Eastern EU
- Jan: 956.8 MT = -14% YoY
- Feb: 778.7 MT = -10% YoY
- Jan-Feb: 1,735.5 MT = -12% YoY
Products
- Raw Frozen Penaeus Shrimp (HS 03061792)
- Jan: 25,928.9 MT = +2% YoY
- Feb: 23,090.0 MT = +7% YoY
- Jan-Feb: 49,019.0 MT = +4% YoY
- Value-Added (HS 160521, HS 160529)
- Jan: 4,675.1 MT = +61% YoY
- Feb: 3,759.2 MT = +12% YoY
- Jan-Feb: 8,434.3 MT = +35% YoY
Top Five Suppliers
- Ecuador
- Jan: 12,514.2 MT = -3% YoY
- Feb: 13,550.5 MT = +31% YoY
- Jan-Feb: 26,064.6 MT = +12% YoY
- India
- Jan: 4,847.8 MT = +68% YoY
- Feb: 4,084.2 MT = +15% YoY
- Jan-Feb: 8,932.0 MT = +38% YoY
- Vietnam
- Jan: 4,483.5 MT = +41% YoY
- Feb: 3,300.5 MT = -13% YoY
- Jan-Feb: 7,784.0 MT = +12% YoY
- Venezuela
- Jan: 2,811.5 MT = -45% YoY
- Feb: 1,230.8 MT = -61% YoY
- Jan-Feb: 4,042.3 MT = -51% YoY
- Bangladesh
- Jan: 1,464.2 MT = +73% YoY
- Feb: 978.6 MT = -14% YoY
- Jan-Feb: 2,442.8 MT = +23% YoY
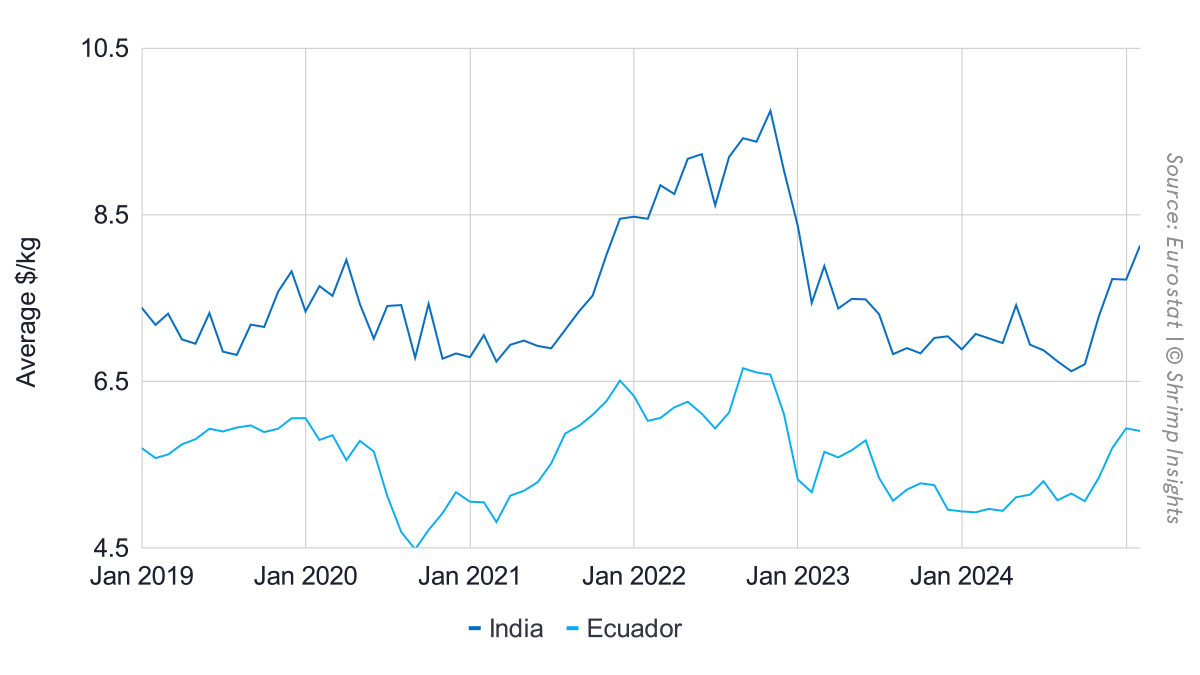
In terms of average prices, in 2025 average import values of raw frozen shrimp from India (primarily peeled) continued to surge. Average prices of imported raw frozen shrimp from Ecuador (primarily HOSO) slightly dropped.