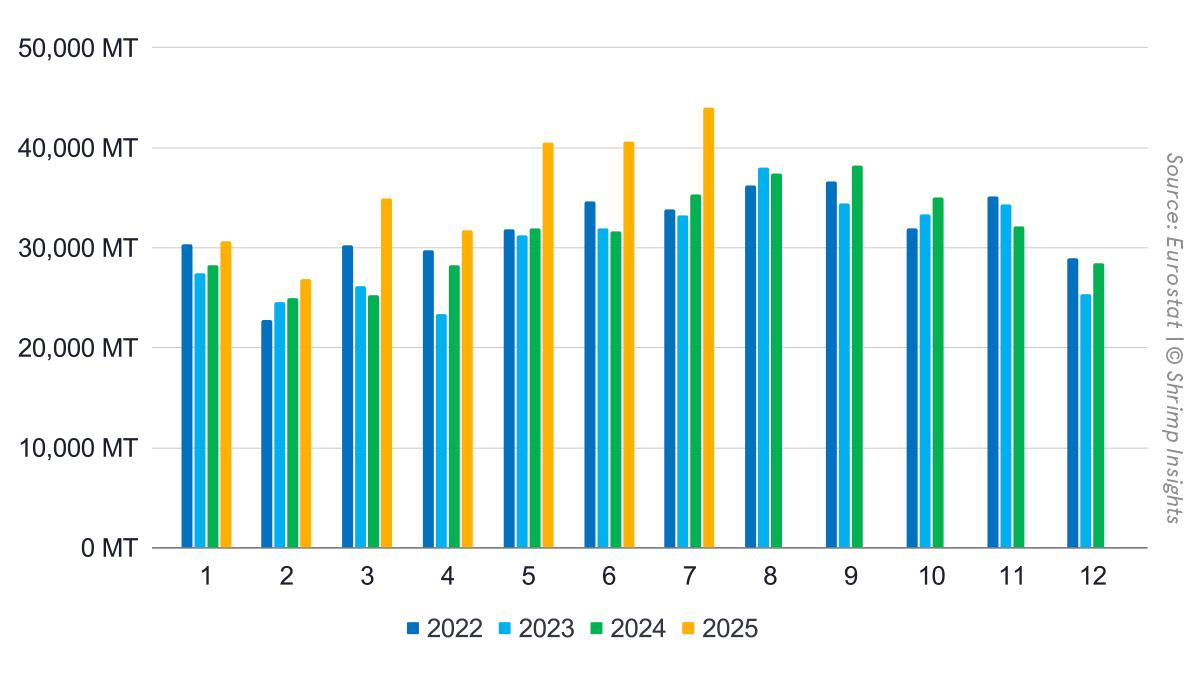
Totals: Imports on a Strong Upward Curve
EU imports of raw frozen Penaeus shrimp (HS 03061792) and value-added products (HS 160521, 160529) from Asia, Latin America, and Africa reached 44,010 MT in July, an increase of 24% compared to the same month last year. This brings total imports in the first seven months of 2025 to 249,302 MT, up 21% year-on-year. In value terms, imports in July amounted to €270 million, up 19% compared to July 2024, resulting in a cumulative value of €1.59 billion for January–July, a 27% increase year-on-year.
Regions: Southern EU Leading, Northwestern EU Follows, East Rebounding
Southern EU remained the largest destination in July with 25,748 MT, representing growth of 24% compared to last year. Northwestern EU followed with 16,585 MT, up 22% year-on-year, while Eastern EU reached 1,676 MT, an increase of 66% compared to July 2024. For the year-to-date, imports stood at 154,085 MT for Southern EU (+23% YoY), 87,967 MT for Northwestern EU (+21% YoY), and 7,251 MT for Eastern EU (+5% YoY).
Products: Raw Frozen Still Dominates, Value-Added Steady Growth
Looking at product categories, imports of raw frozen Penaeus reached 38,452 MT in July, 26% higher than in the same month last year. This brought the total for January–July to 217,700 MT, up 21% year-on-year. Value-added shrimp imports amounted to 5,558 MT in July, an increase of 14% compared to July 2024, with year-to-date volumes reaching 31,602 MT, also up 21% year-on-year.
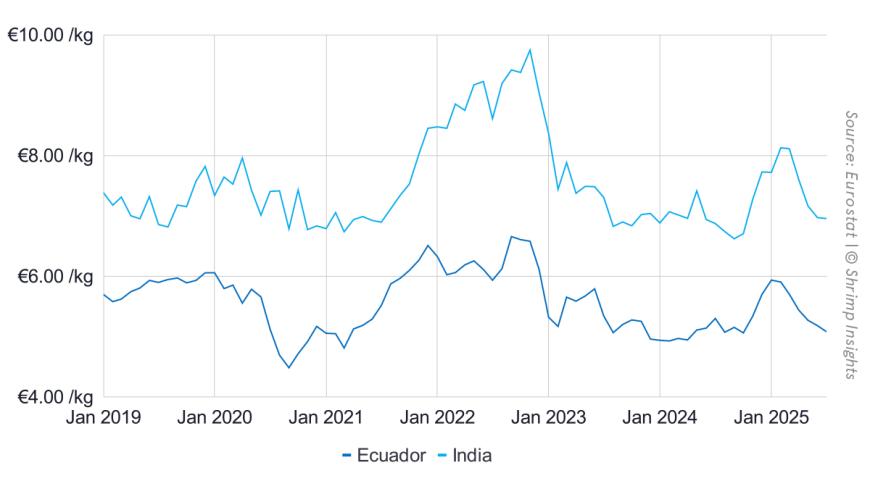
Suppliers: Ecuador Outpaces All, India and Vietnam Grow, Venezuela Collapses
Among supplying countries, Ecuador continued to dominate the market with 24,315 MT in July, an increase of 53% compared to July 2024, lifting its year-to-date volume to 139,078 MT, up 41% year-on-year. India shipped 5,505 MT in July, 23% more than last year, bringing the total for January–July to 31,077 MT, up 25% year-on-year. Vietnam exported 5,638 MT in July, up 3% year-on-year, with its cumulative shipments reaching 29,787 MT, 18% higher than last year. Venezuela supplied 2,187 MT in July, a decline of 44% compared to last year, with year-to-date exports down 46% to 13,431 MT. Bangladesh exported 1,706 MT in July, 75% more than in July 2024, and 6,932 MT in the first seven months of the year, an increase of 29% year-on-year.
Byte in Numbers
Total Raw Frozen Penaeus (HS 03061792) and Value-Added (HS 160521, 160529) from Asia, Latin America, and Africa
- Volume:
- Jan: 30,604 MT = +8% YoY
- Feb: 26,849 MT = +8% YoY
- Mar: 34,960 MT = +39% YoY
- Apr: 31,741 MT = +12% YoY
- May: 40,547 MT = +27% YoY
- Jun: 40,590 MT = +28% YoY
- Jul: 44,010 MT = +24% YoY
- YTD (Jan–Jul): 249,302 MT = +21% YoY
- Value:
- Jan: €212 million = +26% YoY
- Feb: €184 million = +21% YoY
- Mar: €232 million = +56% YoY
- Apr: €201 million = +19% YoY
- May: €246 million = +24% YoY
- Jun: €245 million = +29% YoY
- Jul: €270 million = +19% YoY
- YTD (Jan–Jul): €1,590 million = +27% YoY
Import Regions of Raw Frozen Penaeus and Value-Added from Asia, Latin America, and Africa
- Southern EU:
- Jan: 15,998 MT = -4% YoY
- Feb: 16,252 MT = +15% YoY
- Mar: 22,402 MT = +42% YoY
- Apr: 20,598 MT = +14% YoY
- May: 25,843 MT = +31% YoY
- Jun: 27,244 MT = +32% YoY
- Jul: 25,748 MT = +24% YoY
- YTD (Jan–Jul): 154,085 MT = +23% YoY
- Northwestern EU:
- Jan: 13,649 MT = +30% YoY
- Feb: 9,819 MT = -2% YoY
- Mar: 11,861 MT = +37% YoY
- Apr: 9,995 MT = +9% YoY
- May: 13,731 MT = +27% YoY
- Jun: 12,326 MT = +20% YoY
- Jul: 16,585 MT = +22% YoY
- YTD (Jan–Jul): 87,967 MT = +21% YoY
- Eastern EU:
- Jan: 957 MT = -14% YoY
- Feb: 779 MT = -10% YoY
- Mar: 697 MT = -16% YoY
- Apr: 1,148 MT = +15% YoY
- May: 973 MT = -28% YoY
- Jun: 1,021 MT = +41% YoY
- Jul: 1,676 MT = +66% YoY
- YTD (Jan–Jul): 7,251 MT = +5% YoY
Products
- Raw Frozen Penaeus Shrimp (HS 03061792):
- Jan: 25,929 MT = +2% YoY
- Feb: 23,090 MT = +7% YoY
- Mar: 30,990 MT = +40% YoY
- Apr: 27,518 MT = +11% YoY
- May: 35,613 MT = +29% YoY
- Jun: 36,108 MT = +31% YoY
- Jul: 38,452 MT = +26% YoY
- YTD (Jan–Jul): 217,700 MT = +21% YoY
- Value-Added (HS 160521, HS 160529):
- Jan: 4,675 MT = +61% YoY
- Feb: 3,759 MT = +12% YoY
- Mar: 3,970 MT = +26% YoY
- Apr: 4,224 MT = +24% YoY
- May: 4,934 MT = +14% YoY
- Jun: 4,482 MT = +9% YoY
- Jul: 5,558 MT = +14% YoY
- YTD (Jan–Jul): 31,602 MT = +21% YoY
Top Five Suppliers
- Ecuador:
- Jan: 12,514 MT = -3% YoY
- Feb: 13,550 MT = +31% YoY
- Mar: 19,364 MT = +72% YoY
- Apr: 19,008 MT = +32% YoY
- May: 24,188 MT = +39% YoY
- Jun: 26,138 MT = +61% YoY
- Jul: 24,315 MT = +53% YoY
- YTD (Jan–Jul): 139,078 MT = +41% YoY
- India:
- Jan: 4,848 MT = +68% YoY
- Feb: 4,084 MT = +15% YoY
- Mar: 4,006 MT = +24% YoY
- Apr: 3,608 MT = +8% YoY
- May: 4,817 MT = +25% YoY
- Jun: 4,209 MT = +18% YoY
- Jul: 5,505 MT = +23% YoY
- YTD (Jan–Jul): 31,077 MT = +25% YoY
- Vietnam:
- Jan: 4,484 MT = +41% YoY
- Feb: 3,300 MT = -13% YoY
- Mar: 3,417 MT = +13% YoY
- Apr: 3,557 MT = +33% YoY
- May: 4,791 MT = +53% YoY
- Jun: 4,600 MT = +16% YoY
- Jul: 5,638 MT = +3% YoY
- YTD (Jan–Jul): 29,787 MT = +18% YoY
- Venezuela:
- Jan: 2,811 MT = -45% YoY
- Feb: 1,231 MT = -61% YoY
- Mar: 2,788 MT = -23% YoY
- Apr: 1,483 MT = -55% YoY
- May: 1,996 MT = -9% YoY
- Jun: 935 MT = -75% YoY
- Jul: 2,187 MT = -44% YoY
- YTD (Jan–Jul): 13,431 MT = -46% YoY
- Bangladesh:
- Jan: 1,464 MT = +73% YoY
- Feb: 979 MT = -14% YoY
- Mar: 938 MT = +51% YoY
- Apr: 640 MT = -10% YoY
- May: 573 MT = -10% YoY
- Jun: 632 MT = +41% YoY
- Jul: 1,706 MT = +75% YoY
- YTD (Jan–Jul): 6,932 MT = +29% YoY