EU imports of raw frozen Penaeus shrimp (HS 03061792) and value-added shrimp (HS 160521 and 160529) from Asia, Latin America, and Africa reached 374,517 MT in January–October, an increase of 18% year-on-year. Import value rose faster than volume, reaching €2.35 billion (+21% YoY), reflecting firmer pricing and a product mix tilted slightly toward higher-value origins and formats.
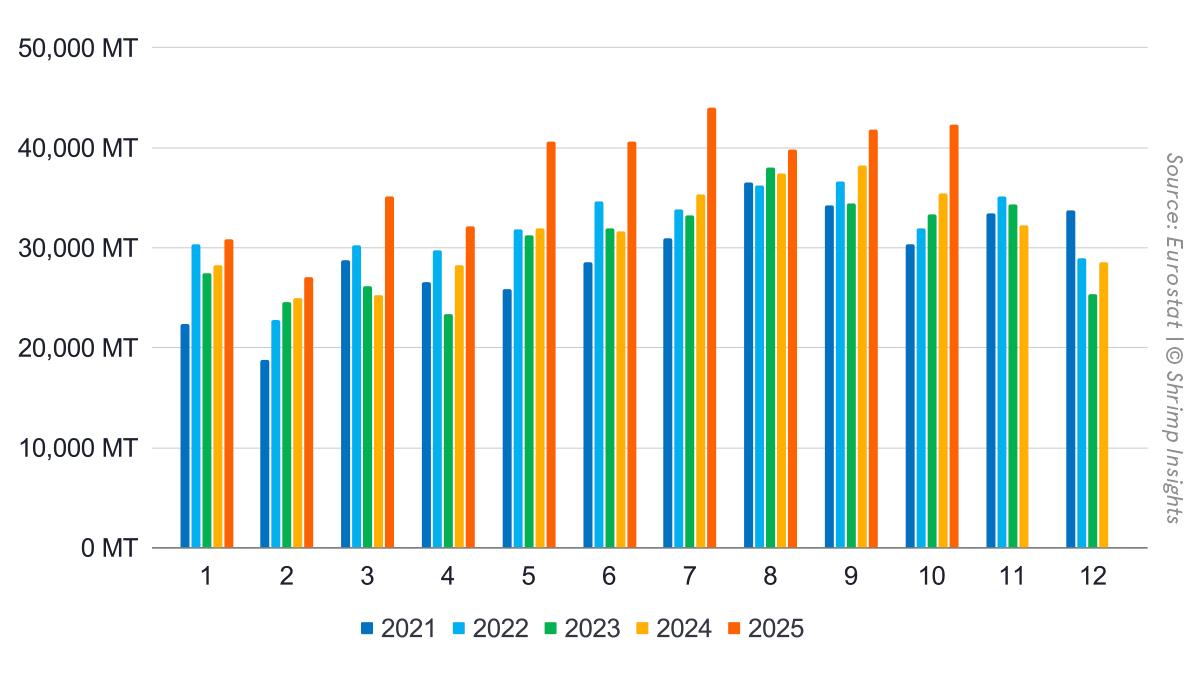
Monthly volumes peaked in July at 44,010 MT. Since then, imports have stabilized at 40,000–42,000 MT, with year-on-year growth slowing from the extreme levels observed in Q2. October still delivered solid growth (+19% YoY), but the data suggest a more cautious buying pattern in the second half of the year.
Import Regions
Southern Europe remained the main growth engine, with imports reaching 228,019 MT YTD (+19% YoY). Growth was broad-based and robust in March through June, followed by a moderation in late summer. October showed a renewed uptick, suggesting demand remains resilient despite higher inventories.
Northwestern Europe imported 134,562 MT (+17% YoY) in January–October. After substantial gains in the first half of the year, growth slowed markedly in September and October, indicating more disciplined purchasing and a greater focus on stock management.
Eastern Europe accounted for 11,935 MT (+13% YoY). Volumes remain small in absolute terms but have shown improving momentum since mid-year, with strong year-on-year growth in July and September.
Products
Raw frozen Penaeus shrimp continued to dominate EU imports, reaching 327,702 MT in January–October (+18% YoY). Growth was strongest in Q2 and early Q3, after which volumes levelled off, mirroring the overall market trend.
Value-added shrimp imports reached 46,815 MT (+18% YoY). While growth remains structurally positive, monthly increases have become more moderate since mid-year, suggesting stable rather than accelerating demand for processed products.
Top Five Suppliers
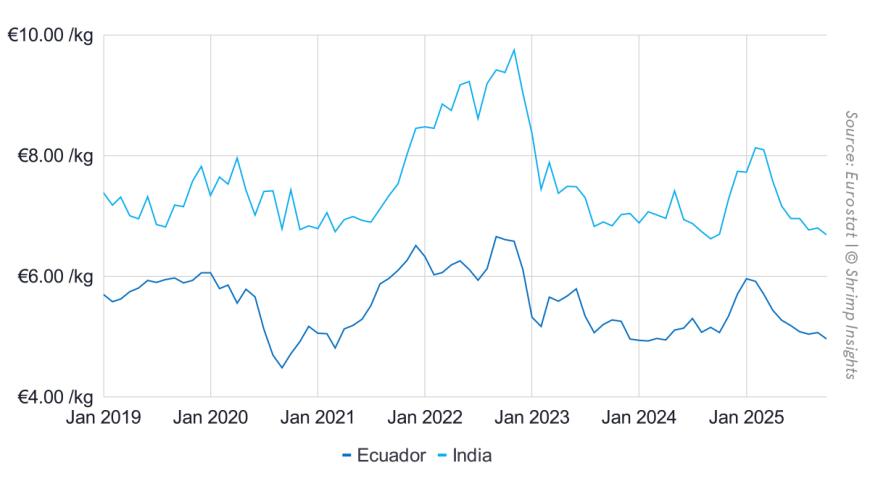
Ecuador further strengthened its position as the EU’s leading supplier, with exports reaching 203,753 MT in January–October (+37% YoY). Growth remained strong throughout the year and accelerated again in October, underlining Ecuador’s role as the primary volume and price-competitive origin.
India supplied 51,488 MT (+33% YoY), with robust growth in the second half of the year. Rising volumes in August, September, and October indicate continued market-share gains, supported by competitive pricing and improving availability.
Vietnam exported 45,973 MT (+12% YoY). After a solid first half, growth stalled from August onward, with slightly negative year-on-year results in recent months, reflecting weaker EU demand for higher-priced value-added products.
Venezuela continued to lose ground, with shipments declining to 18,044 MT (-51% YoY). The contraction remained severe across all months, highlighting persistent structural and political challenges.
Bangladesh reached 12,339 MT (+20% YoY). Growth was uneven from month to month, but the overall trend indicates a gradual recovery and improved market access.
Byte in Numbers
Total Raw Frozen Penaeus (HS 03061792) and Value-Added (HS 160521, 160529) from Asia, Latin America, and Africa
- Volume:
- Jan: 30,604 MT = +8% YoY
- Feb: 26,849 MT = +8% YoY
- Mar: 34,960 MT = +39% YoY
- Apr: 31,741 MT = +12% YoY
- May: 40,547 MT = +27% YoY
- Jun: 40,590 MT = +28% YoY
- Jul: 44,010 MT = +24% YoY
- Aug: 39,840 MT = +6% YoY
- Sep: 41,865 MT = +10% YoY
- Oct: 42,325 MT = +19% YoY
- YTD (Jan–Oct): 374,517 MT = +18% YoY
- Value:
- Jan: €212 million = +26% YoY
- Feb: €184 million = +21% YoY
- Mar: €232 million = +56% YoY
- Apr: €201 million = +19% YoY
- May: €246 million = +24% YoY
- Jun: €245 million = +29% YoY
- Jul: €270 million = +19% YoY
- Aug: €246 million = +8% YoY
- Sep: €257 million = +9% YoY
- Oct: €252 million = +13% YoY
- YTD (Jan–Oct): €2,353 million = +21% YoY
Import Regions of Raw Frozen Penaeus and Value-Added from Asia, Latin America, and Africa
- Southern EU:
- Jan: 16,018 MT = -4% YoY
- Feb: 16,252 MT = +15% YoY
- Mar: 22,397 MT = +42% YoY
- Apr: 20,577 MT = +14% YoY
- May: 25,849 MT = +31% YoY
- Jun: 27,244 MT = +32% YoY
- Jul: 25,748 MT = +24% YoY
- Aug: 23,403 MT = +1% YoY
- Sep: 24,756 MT = +12% YoY
- Oct: 25,776 MT = +26% YoY
- YTD (Jan–Oct): 228,019 MT = +19% YoY
- Northwestern EU:
- Jan: 13,848 MT = +32% YoY
- Feb: 9,986 MT = +0% YoY
- Mar: 12,077 MT = +39% YoY
- Apr: 10,409 MT = +14% YoY
- May: 13,798 MT = +27% YoY
- Jun: 12,363 MT = +21% YoY
- Jul: 16,639 MT = +22% YoY
- Aug: 15,200 MT = +16% YoY
- Sep: 15,174 MT = +1% YoY
- Oct: 15,070 MT = +9% YoY
- YTD (Jan–Oct): 134,562 MT = +17% YoY
- Eastern EU:
- Jan: 957 MT = -14% YoY
- Feb: 779 MT = -10% YoY
- Mar: 697 MT = -16% YoY
- Apr: 1,148 MT = +15% YoY
- May: 973 MT = -28% YoY
- Jun: 1,021 MT = +41% YoY
- Jul: 1,676 MT = +66% YoY
- Aug: 1,270 MT = 0% YoY
- Sep: 1,935 MT = +61% YoY
- Oct: 1,479 MT = +23% YoY
- YTD (Jan–Oct): 11,935 MT = +13% YoY
Products
- Raw Frozen Penaeus Shrimp (HS 03061792):
- Jan: 26,143 MT = +3% YoY
- Feb: 23,272 MT = +8% YoY
- Mar: 31,158 MT = +41% YoY
- Apr: 27,820 MT = +12% YoY
- May: 35,669 MT = +29% YoY
- Jun: 36,203 MT = +32% YoY
- Jul: 38,505 MT = +26% YoY
- Aug: 35,110 MT = +6% YoY
- Sep: 36,730 MT = +9% YoY
- Oct: 37,092 MT = +20% YoY
- YTD (Jan–Oct): 327,702 MT = +18% YoY
- Value-Added (HS 160521, HS 160529):
- Jan: 4,680 MT = +61% YoY
- Feb: 3,745 MT = +12% YoY
- Mar: 4,013 MT = +27% YoY
- Apr: 4,313 MT = +27% YoY
- May: 4,951 MT = +14% YoY
- Jun: 4,425 MT = +8% YoY
- Jul: 5,558 MT = +14% YoY
- Aug: 4,762 MT = +7% YoY
- Sep: 5,135 MT = +16% YoY
- Oct: 5,233 MT = +12% YoY
- YTD (Jan–Oct): 46,815 MT = +18% YoY
Top Five Suppliers
- Ecuador:
- Jan: 12,724 MT = -2% YoY
- Feb: 13,630 MT = +32% YoY
- Mar: 19,382 MT = +72% YoY
- Apr: 18,986 MT = +32% YoY
- May: 24,233 MT = +39% YoY
- Jun: 26,180 MT = +62% YoY
- Jul: 24,354 MT = +53% YoY
- Aug: 21,083 MT = +8% YoY
- Sep: 21,220 MT = +33% YoY
- Oct: 21,960 MT = +43% YoY
- YTD (Jan–Oct): 203,753 MT = +37% YoY
- India:
- Jan: 4,864 MT = +68% YoY
- Feb: 4,084 MT = +15% YoY
- Mar: 4,028 MT = +25% YoY
- Apr: 3,694 MT = +10% YoY
- May: 4,800 MT = +25% YoY
- Jun: 4,251 MT = +19% YoY
- Jul: 5,505 MT = +23% YoY
- Aug: 5,788 MT = +43% YoY
- Sep: 7,101 MT = +34% YoY
- Oct: 7,372 MT = +67% YoY
- YTD (Jan–Oct): 51,488 MT = +33% YoY
- Viet Nam:
- Jan: 4,484 MT = +41% YoY
- Feb: 3,422 MT = -10% YoY
- Mar: 3,594 MT = +18% YoY
- Apr: 3,846 MT = +44% YoY
- May: 4,845 MT = +54% YoY
- Jun: 4,600 MT = +16% YoY
- Jul: 5,652 MT = +3% YoY
- Aug: 5,224 MT = -2% YoY
- Sep: 5,364 MT = -1% YoY
- Oct: 4,942 MT = -2% YoY
- YTD (Jan–Oct): 45,973 MT = +12% YoY
- Venezuela:
- Jan: 2,832 MT = -44% YoY
- Feb: 1,231 MT = -61% YoY
- Mar: 2,783 MT = -23% YoY
- Apr: 1,483 MT = -55% YoY
- May: 1,996 MT = -9% YoY
- Jun: 935 MT = -75% YoY
- Jul: 2,187 MT = -44% YoY
- Aug: 1,595 MT = -44% YoY
- Sep: 1,524 MT = -73% YoY
- Oct: 1,479 MT = -54% YoY
- YTD (Jan–Oct): 18,044 MT = -51% YoY
- Bangladesh:
- Jan: 1,464 MT = +73% YoY
- Feb: 963 MT = -16% YoY
- Mar: 938 MT = +51% YoY
- Apr: 640 MT = -10% YoY
- May: 573 MT = -10% YoY
- Jun: 653 MT = +46% YoY
- Jul: 1,706 MT = +75% YoY
- Aug: 1,739 MT = +29% YoY
- Sep: 1,865 MT = +31% YoY
- Oct: 1,799 MT = -17% YoY
- YTD (Jan–Oct): 12,339 MT = +20% YoY