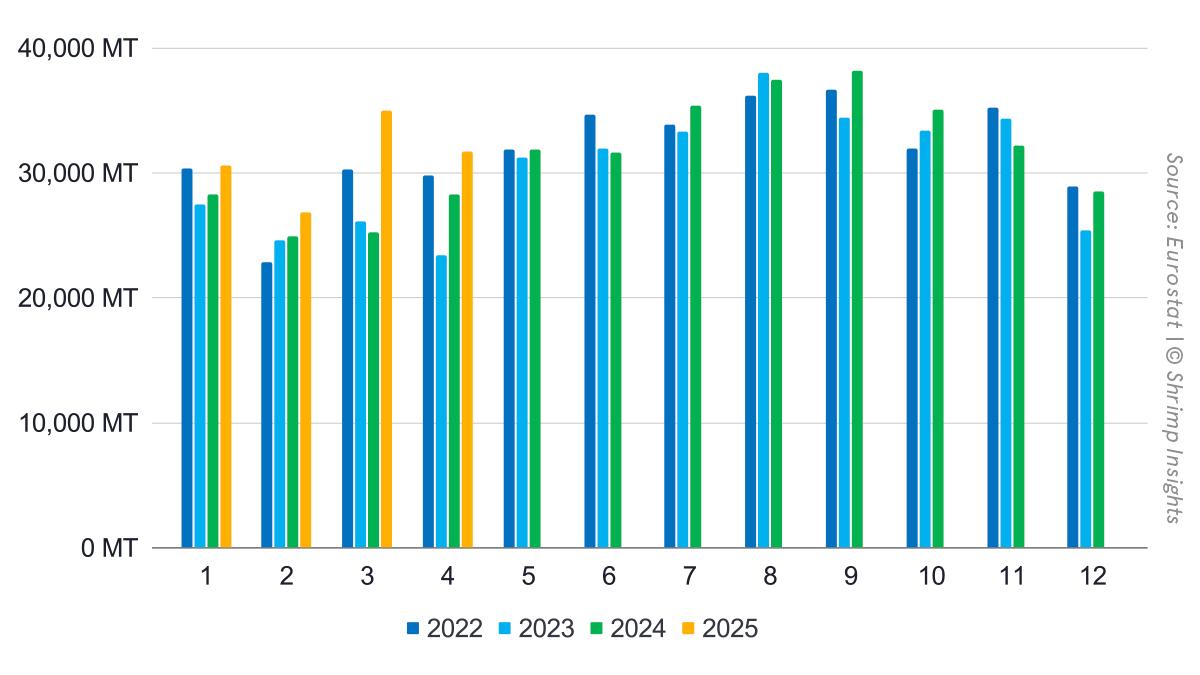
Steady Growth in Volume and Value
EU imports of raw frozen and value-added Penaeus shrimp (HS 03061792, 160521, 160529) from Asia, Latin America, and Africa maintained strong momentum in April. Imports reached 31,741 MT, up 12% YoY, bringing the year-to-date total to 124,155 MT, +16% YoY. In value terms, April imports reached €201 million, up 19% YoY, with YTD value hitting €829 million, +30% YoY, reflecting both higher volumes and improved average prices.
Southern and Northwestern EU Drive Demand
Southern Europe, which absorbs the largest share, imported 20,598 MT in April, up 14% YoY, and 75,250 MT YTD, up 16% YoY. Northwestern Europe followed with 9,995 MT in April (+9% YoY) and 45,324 MT YTD (+19% YoY). Eastern Europe remained modest with 1,148 MT in April, but showed signs of recovery (+15% YoY) after months of decline. Still, its YTD imports of 3,581 MT remain 6% below last year.
Raw Frozen Dominates, Value-Added Gains Share
In terms of product categories, raw frozen shrimp dominated with 27,518 MT in April (+11% YoY) and 107,527 MT YTD (+15% YoY). Meanwhile, value-added imports reached 4,224 MT in April (+24% YoY), boosting the YTD total to 16,628 MT, a +30% YoY increase—highlighting the growing demand for processed shrimp formats.
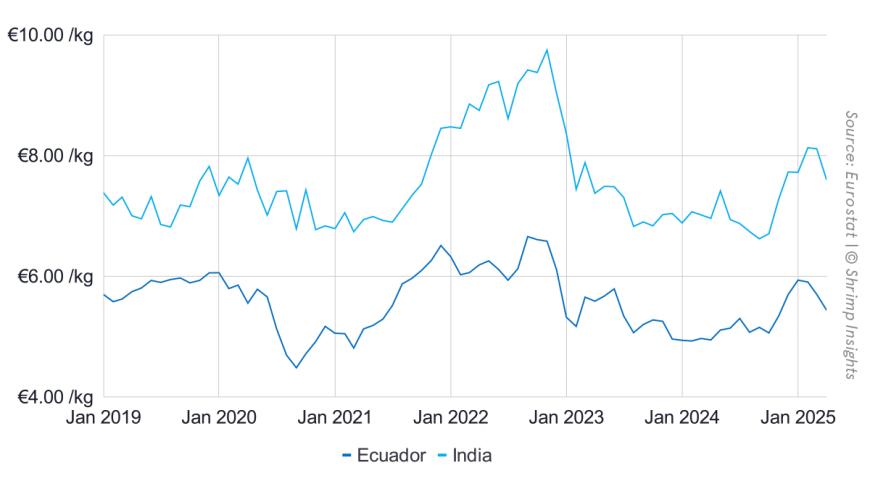
Ecuador Expands Lead, India and Vietnam Follow
Ecuador further solidified its leading position in the EU market with 19,008 metric tons in April (+32% year-over-year) and a year-to-date total of 64,437 metric tons, also up 32% year-over-year. India and Vietnam also expanded their exports, with India shipping 3,608 MT in April (+8% YoY) and 16,546 MT YTD (+27% YoY), and Vietnam sending 3,557 MT in April (+33% YoY) and 14,758 MT YTD (+16% YoY). Bangladesh, while still smaller in scale, contributed 640 MT in April (-10% YoY) and 4,021 MT YTD, marking a +21% YoY increase—driven by strong early-year performance.
Venezuela’s Decline Persists
By contrast, Venezuelan exports declined sharply, down 55% YoY in April, with YTD volumes falling to 8,313 MT, -45% YoY, continuing a persistent downward trend.
Data
Total Raw Frozen Penaeus (HS 03061792) and Value-Added (HS 160521, 160529) from Asia, Latin America, and Africa
- Volume:
- Jan: 30,604 MT = +8% YoY
- Feb: 26,849 MT = +8% YoY
- Mar: 34,960 MT = +39% YoY
- Apr: 31,741 MT = +12% YoY
- YTD (Jan–Apr): 124,155 MT = +16% YoY
- Value:
- Jan: €212 million = +26% YoY
- Feb: €184 million = +21% YoY
- Mar: €232 million = +56% YoY
- Apr: €201 million = +19% YoY
- YTD (Jan–Apr): €829 million = +30% YoY
Import Regions of Raw Frozen Penaeus (HS 03061792) and Value-Added (HS 160521, 160529) from Asia, Latin America, and Africa
- Southern EU:
- Jan: 15,998 MT = -4% YoY
- Feb: 16,252 MT = +15% YoY
- Mar: 22,402 MT = +42% YoY
- Apr: 20,598 MT = +14% YoY
- YTD (Jan–Apr): 75,250 MT = +16% YoY
- Northwestern EU:
- Jan: 13,649 MT = +30% YoY
- Feb: 9,819 MT = -2% YoY
- Mar: 11,861 MT = +37% YoY
- Apr: 9,995 MT = +9% YoY
- YTD (Jan–Apr): 45,324 MT = +19% YoY
- Eastern EU:
- Jan: 957 MT = -14% YoY
- Feb: 779 MT = -10% YoY
- Mar: 697 MT = -16% YoY
- Apr: 1,148 MT = +15% YoY
- YTD (Jan–Apr): 3,581 MT = -6% YoY
Products
- Raw Frozen Penaeus Shrimp (HS 03061792)
- Jan: 25,929 MT = +2% YoY
- Feb: 23,090 MT = +7% YoY
- Mar: 30,990 MT = +40% YoY
- Apr: 27,518 MT = +11% YoY
- YTD (Jan–Apr): 107,527 MT = +15% YoY
- Value-Added (HS 160521, HS 160529)
- Jan: 4,675 MT = +61% YoY
- Feb: 3,759 MT = +12% YoY
- Mar: 3,970 MT = +26% YoY
- Apr: 4,224 MT = +24% YoY
- YTD (Jan–Apr): 16,628 MT = +30% YoY
Top Five Suppliers
- Ecuador
- Jan: 12,514 MT = -3% YoY
- Feb: 13,551 MT = +31% YoY
- Mar: 19,364 MT = +72% YoY
- Apr: 19,008 MT = +32% YoY
- YTD (Jan–Apr): 64,437 MT = +32% YoY
- India
- Jan: 4,848 MT = +68% YoY
- Feb: 4,084 MT = +15% YoY
- Mar: 4,006 MT = +24% YoY
- Apr: 3,608 MT = +8% YoY
- YTD (Jan–Apr): 16,546 MT = +27% YoY
- Vietnam
- Jan: 4,484 MT = +41% YoY
- Feb: 3,301 MT = -13% YoY
- Mar: 3,417 MT = +13% YoY
- Apr: 3,557 MT = +33% YoY
- YTD (Jan–Apr): 14,758 MT = +16% YoY
- Venezuela
- Jan: 2,812 MT = -45% YoY
- Feb: 1,231 MT = -61% YoY
- Mar: 2,788 MT = -23% YoY
- Apr: 1,483 MT = -55% YoY
- YTD (Jan–Apr): 8,313 MT = -45% YoY
- Bangladesh
- Jan: 1,464 MT = +73% YoY
- Feb: 979 MT = -14% YoY
- Mar: 938 MT = +51% YoY
- Apr: 640 MT = -10% YoY
- YTD (Jan–Apr): 4,021 MT = +21% YoY