Totals
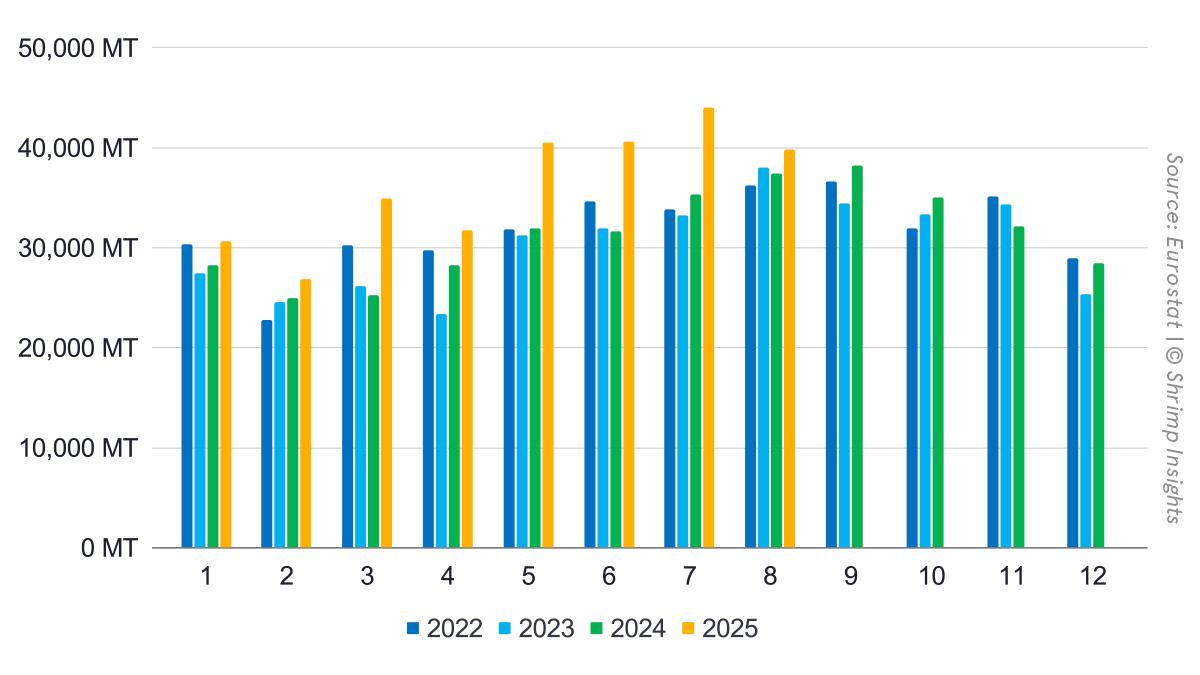
EU shrimp imports continued their strong recovery through 2025. From January to August, total imports of raw frozen and value-added Penaeus shrimp from Asia, Latin America, and Africa reached 289,142 MT, marking a +19% increase year-on-year. In value terms, imports rose even faster — €1.84 billion, up +24% YoY.
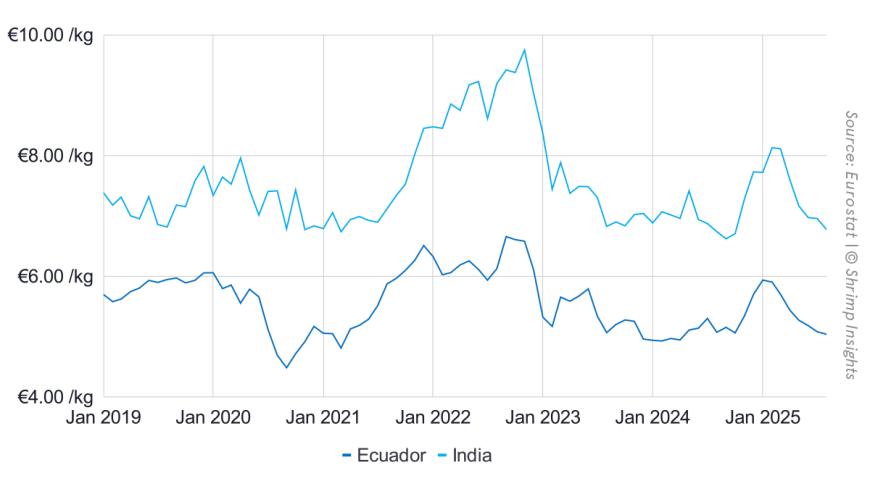
However, August showed signs of slowing momentum. Import volumes reached 39,840 MT, up only +6% YoY, while values climbed +8% YoY to €246 million, indicating that the rapid growth seen earlier in the year is moderating as the market stabilizes. Also, averages import prices continue to drop and are getting closer to last year’s levels, raising doubt about the sustainability of the EU’s surge of imports.
Regions
Southern Europe — led by Spain, Italy, and Portugal — accounted for the bulk of imports with 177,488 MT, up +19% YoY. Growth here slowed in August, with just +1% YoY. Northwestern Europe, driven by markets such as France, Belgium, and the Netherlands, performed slightly better, with 103,133 MT imported year-to-date (+20% YoY) and +16% in August. Eastern European markets remained relatively small but steady at 8,520 MT, representing +5% YoY growth.
Products
Raw frozen shrimp dominated EU imports, totaling 252,789 MT between January and August — a +19% YoY increase. Value-added imports also grew by +19% YoY to 36,353 MT, maintaining a stable share of total imports. Both categories saw softer growth in August (+6% for raw and +7% for value-added), reflecting a broader easing after months of robust expansion.
Suppliers
Ecuador remained the EU’s dominant supplier, shipping 160,139 MT so far this year, up a striking +36% YoY. While August still showed positive growth (+8% YoY), the pace was notably slower than earlier months when shipments rose over 50%.
India consolidated its position as the second-largest supplier, with 36,880 MT (+27% YoY). Notably, August imports from India rose sharply by +43% YoY, suggesting stronger demand for its raw and value-added offerings.
Vietnam followed closely with 35,004 MT (+14% YoY), maintaining stable growth through mid-year, though August saw a slight decline (-2% YoY).
Venezuela’s exports to the EU continued to shrink dramatically. Imports from the country fell -46% YoY to 15,027 MT, reflecting ongoing challenges in production and trade.
Bangladesh, meanwhile, achieved solid recovery, exporting 8,655 MT, up +29% YoY, driven by strong July and August shipments of black tiger shrimp.
Conclusion
After a strong first half marked by double-digit growth, EU shrimp imports in August suggest the market may be approaching equilibrium. While Ecuador and India continue to lead, growth from Southeast Asia has stabilized, and Venezuela remains in sharp decline. The coming months will reveal whether the slowdown is seasonal or marks a shift toward more normalized import levels.
Byte in Numbers
Total Raw Frozen Penaeus (HS 03061792) and Value-Added (HS 160521, 160529) from Asia, Latin America, and Africa
- Volume:
- Jan: 30,604 MT = +8% YoY
- Feb: 26,849 MT = +8% YoY
- Mar: 34,960 MT = +39% YoY
- Apr: 31,741 MT = +12% YoY
- May: 40,547 MT = +27% YoY
- Jun: 40,590 MT = +28% YoY
- Jul: 44,010 MT = +24% YoY
- Aug: 39,840 MT = +6% YoY
- YTD (Jan–Aug): 289,142 MT = +19% YoY
- Value:
- Jan: €212 million = +26% YoY
- Feb: €184 million = +21% YoY
- Mar: €232 million = +56% YoY
- Apr: €201 million = +19% YoY
- May: €246 million = +24% YoY
- Jun: €245 million = +29% YoY
- Jul: €270 million = +19% YoY
- Aug: €246 million = +8% YoY
- YTD (Jan–Aug): €1,836 million = +24% YoY
Import Regions of Raw Frozen Penaeus and Value-Added from Asia, Latin America, and Africa
- Southern EU:
- Jan: 15,998 MT = -4% YoY
- Feb: 16,252 MT = +15% YoY
- Mar: 22,402 MT = +42% YoY
- Apr: 20,598 MT = +14% YoY
- May: 25,843 MT = +31% YoY
- Jun: 27,244 MT = +32% YoY
- Jul: 25,748 MT = +24% YoY
- Aug: 23,403 MT = +1% YoY
- YTD (Jan–Aug): 177,488 MT = +19% YoY
- Northwestern EU:
- Jan: 13,649 MT = +30% YoY
- Feb: 9,819 MT = -2% YoY
- Mar: 11,861 MT = +37% YoY
- Apr: 9,995 MT = +9% YoY
- May: 13,731 MT = +27% YoY
- Jun: 12,326 MT = +20% YoY
- Jul: 16,585 MT = +22% YoY
- Aug: 15,167 MT = +16% YoY
- YTD (Jan–Aug): 103,133 MT = +20% YoY
- Eastern EU:
- Jan: 957 MT = -14% YoY
- Feb: 779 MT = -10% YoY
- Mar: 697 MT = -16% YoY
- Apr: 1,148 MT = +15% YoY
- May: 973 MT = -28% YoY
- Jun: 1,021 MT = +41% YoY
- Jul: 1,676 MT = +66% YoY
- Aug: 1,270 MT = 0% YoY
- YTD (Jan–Aug): 8,520 MT = +5% YoY
Products
- Raw Frozen Penaeus Shrimp (HS 03061792):
- Jan: 25,929 MT = +2% YoY
- Feb: 23,090 MT = +7% YoY
- Mar: 30,990 MT = +40% YoY
- Apr: 27,518 MT = +11% YoY
- May: 35,613 MT = +29% YoY
- Jun: 36,108 MT = +31% YoY
- Jul: 38,452 MT = +26% YoY
- Aug: 35,088 MT = +6% YoY
- YTD (Jan–Aug): 252,789 MT = +19% YoY
- Value-Added (HS 160521, HS 160529):
- Jan: 4,675 MT = +61% YoY
- Feb: 3,759 MT = +12% YoY
- Mar: 3,970 MT = +26% YoY
- Apr: 4,224 MT = +24% YoY
- May: 4,934 MT = +14% YoY
- Jun: 4,482 MT = +9% YoY
- Jul: 5,558 MT = +14% YoY
- Aug: 4,751 MT = +7% YoY
- YTD (Jan–Aug): 36,353 MT = +19% YoY
Top Five Suppliers
- Ecuador:
- Jan: 12,514 MT = -3% YoY
- Feb: 13,550 MT = +31% YoY
- Mar: 19,364 MT = +72% YoY
- Apr: 19,008 MT = +32% YoY
- May: 24,188 MT = +39% YoY
- Jun: 26,138 MT = +61% YoY
- Jul: 24,315 MT = +53% YoY
- Aug: 21,061 MT = +8% YoY
- YTD (Jan–Aug): 160,139 MT = +36% YoY
- India:
- Jan: 4,848 MT = +68% YoY
- Feb: 4,084 MT = +15% YoY
- Mar: 4,006 MT = +24% YoY
- Apr: 3,608 MT = +8% YoY
- May: 4,817 MT = +25% YoY
- Jun: 4,209 MT = +18% YoY
- Jul: 5,505 MT = +23% YoY
- Aug: 5,803 MT = +43% YoY
- YTD (Jan–Aug): 36,880 MT = +27% YoY
- Vietnam:
- Jan: 4,484 MT = +41% YoY
- Feb: 3,300 MT = -13% YoY
- Mar: 3,417 MT = +13% YoY
- Apr: 3,557 MT = +33% YoY
- May: 4,791 MT = +53% YoY
- Jun: 4,600 MT = +16% YoY
- Jul: 5,638 MT = +3% YoY
- Aug: 5,217 MT = -2% YoY
- YTD (Jan–Aug): 35,004 MT = +14% YoY
- Venezuela:
- Jan: 2,811 MT = -45% YoY
- Feb: 1,231 MT = -61% YoY
- Mar: 2,788 MT = -23% YoY
- Apr: 1,483 MT = -55% YoY
- May: 1,996 MT = -9% YoY
- Jun: 935 MT = -75% YoY
- Jul: 2,187 MT = -44% YoY
- Aug: 1,595 MT = -44% YoY
- YTD (Jan–Aug): 15,027 MT = -46% YoY
- Bangladesh:
- Jan: 1,464 MT = +73% YoY
- Feb: 979 MT = -14% YoY
- Mar: 938 MT = +51% YoY
- Apr: 640 MT = -10% YoY
- May: 573 MT = -10% YoY
- Jun: 632 MT = +41% YoY
- Jul: 1,706 MT = +75% YoY
- Aug: 1,724 MT = +28% YoY
- YTD (Jan–Aug): 8,655 MT = +29% YoY