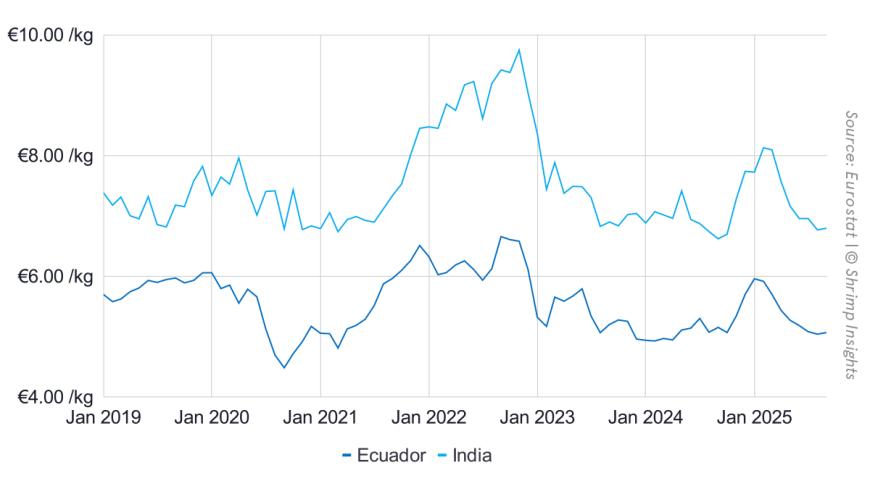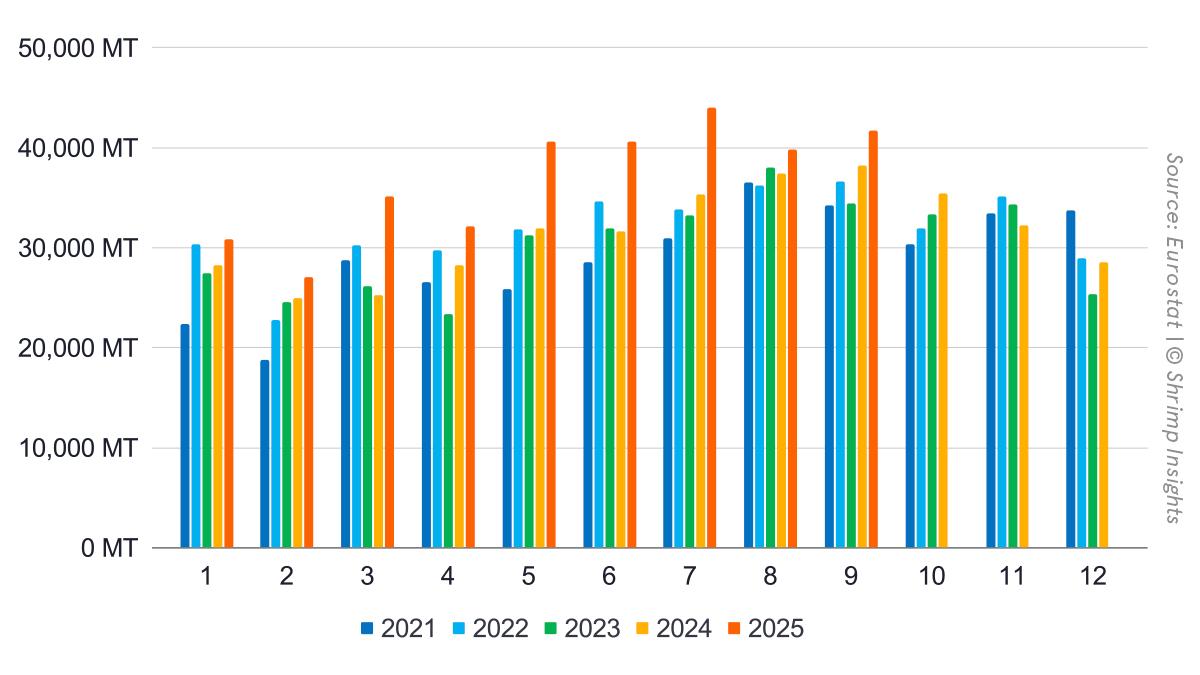
EU imports of raw frozen Penaeus and value-added shrimp from Asia, Latin America, and Africa totaled 41,771 MT in September, up 9% year on year. Although still positive, this marks a clear slowdown compared to the double-digit growth seen from March through July and the firmer performance in August. Despite the softer September, cumulative imports for January–September reached 332,097 MT, up 18% year-on-year, showing that the EU market remains significantly stronger than last year. In value terms, imports rose to €256 million in September (+9% YoY), bringing the year-to-date total to €2.1 billion, up 22% YoY and indicating higher EUR/kg values throughout 2024. As the figure below shows, the reduced growth is accompanied by more stable average values per kilogram of imported shrimp.
Regional Markets: Southern and Northwestern EU Maintain Growth but Also Ease in September
Growth slowed across all major regions in September. Southern EU imported 24,756 MT, up 12% YoY, a more modest increase than earlier months, when growth routinely exceeded 25–30%. Its January–September total reached 202,243 MT (+18% YoY), keeping the region on track for one of its strongest years. Northwestern EU saw shipments edge up only 1% YoY in September to 15,079 MT, a clear deceleration after several strong months in the first half of the year. Still, cumulative imports reached 119,398 MT, also up 18% YoY. Eastern EU stood out with 1,935 MT in September (+61% YoY), but this follows several softer months, and volatility remains high. Its nine-month total rose to 10,456 MT (+12% YoY), slightly below the growth rate in the western regions but still positive.
Products: Raw Frozen and Value-Added Both Grow, but Below the Levels Seen Earlier in the Year
Imports of raw frozen Penaeus reached 36,688 MT in September, growing 9% YoY. This is substantially lower than the 25–40% YoY increases recorded in the spring and early summer. Even so, raw frozen imports reached 290,567 MT year-to-date, up 18% YoY. Value-added products also grew at a softer pace. September imports reached 5,083 MT (+15% YoY), compared to much stronger growth earlier in the year. Value-added volumes remained solid overall at 41,530 MT for January–September, up 19% YoY.
Suppliers: Ecuador and India Hold Strong Trends While Viet Nam Levels Off and Venezuela Continues to Decline
Ecuador remained the dominant supplier with 21,205 MT in September, up 33% YoY, but this was below the steep 50–70% increases seen in the second quarter. Its year-to-date total of 181,777 MT represents 36% growth, showing continued expansion at a more moderate pace. India delivered one of its best months of the year with 7,051 MT (+33% YoY), pushing its cumulative total to 44,066 MT (+28% YoY). Viet Nam shipped 5,343 MT in September, slightly below last year, confirming that its growth has flattened after a strong spring. Its year-to-date total reached 41,010 MT (+14% YoY). Venezuela continued its sharp decline, with 1,524 MT in September (-73% YoY), bringing the year-to-date total to 16,565 MT, down 51%. Bangladesh maintained strong momentum in its monodon-led segment, shipping 1,865 MT in September (+31% YoY) and reaching 10,540 MT year-to-date, up 29% YoY.
Byte in Numbers
Total Raw Frozen Penaeus (HS 03061792) and Value-Added (HS 160521, 160529) from Asia, Latin America, and Africa
- Volume:
- Jan: 30,604 MT = +8% YoY
- Feb: 26,849 MT = +8% YoY
- Mar: 34,960 MT = +39% YoY
- Apr: 31,741 MT = +12% YoY
- May: 40,547 MT = +27% YoY
- Jun: 40,590 MT = +28% YoY
- Jul: 44,010 MT = +24% YoY
- Aug: 39,840 MT = +6% YoY
- Sep: 41,771 MT = +9% YoY
- YTD (Jan–Sep): 332,097 MT = +18% YoY
- Value:
- Jan: €212 million = +26% YoY
- Feb: €184 million = +21% YoY
- Mar: €232 million = +56% YoY
- Apr: €201 million = +19% YoY
- May: €246 million = +24% YoY
- Jun: €245 million = +29% YoY
- Jul: €270 million = +19% YoY
- Aug: €246 million = +8% YoY
- Sep: €256 million = +9% YoY
- YTD (Jan–Sep): €2,100 million = +22% YoY
Import Regions of Raw Frozen Penaeus and Value-Added from Asia, Latin America, and Africa
- Southern EU:
- Jan: 16,018 MT = -4% YoY
- Feb: 16,252 MT = +15% YoY
- Mar: 22,397 MT = +42% YoY
- Apr: 20,577 MT = +14% YoY
- May: 25,849 MT = +31% YoY
- Jun: 27,244 MT = +32% YoY
- Jul: 25,748 MT = +24% YoY
- Aug: 23,403 MT = +1% YoY
- Sep: 24,756 MT = +12% YoY
- YTD (Jan–Sep): 202,243 MT = +18% YoY
- Northwestern EU:
- Jan: 13,848 MT = +32% YoY
- Feb: 9,986 MT = +0% YoY
- Mar: 12,077 MT = +39% YoY
- Apr: 10,409 MT = +14% YoY
- May: 13,798 MT = +27% YoY
- Jun: 12,363 MT = +21% YoY
- Jul: 16,639 MT = +22% YoY
- Aug: 15,200 MT = +16% YoY
- Sep: 15,079 MT = +1% YoY
- YTD (Jan–Sep): 119,398 MT = +18% YoY
- Eastern EU:
- Jan: 957 MT = -14% YoY
- Feb: 779 MT = -10% YoY
- Mar: 697 MT = -16% YoY
- Apr: 1,148 MT = +15% YoY
- May: 973 MT = -28% YoY
- Jun: 1,021 MT = +41% YoY
- Jul: 1,676 MT = +66% YoY
- Aug: 1,270 MT = 0% YoY
- Sep: 1,935 MT = +61% YoY
- YTD (Jan–Sep): 10,456 MT = +12% YoY
Products
- Raw Frozen Penaeus Shrimp (HS 03061792):
- Jan: 26,143 MT = +3% YoY
- Feb: 23,272 MT = +8% YoY
- Mar: 31,158 MT = +41% YoY
- Apr: 27,820 MT = +12% YoY
- May: 35,669 MT = +29% YoY
- Jun: 36,203 MT = +32% YoY
- Jul: 38,505 MT = +26% YoY
- Aug: 35,110 MT = +6% YoY
- Sep: 36,688 MT = +9% YoY
- YTD (Jan–Sep): 290,567 MT = +18% YoY
- Value-Added (HS 160521, HS 160529):
- Jan: 4,680 MT = +61% YoY
- Feb: 3,745 MT = +12% YoY
- Mar: 4,013 MT = +27% YoY
- Apr: 4,313 MT = +27% YoY
- May: 4,951 MT = +14% YoY
- Jun: 4,425 MT = +8% YoY
- Jul: 5,558 MT = +14% YoY
- Aug: 4,762 MT = +7% YoY
- Sep: 5,083 MT = +15% YoY
- YTD (Jan–Sep): 41,530 MT = +19% YoY
Top Five Suppliers
- Ecuador:
- Jan: 12,724 MT = -2% YoY
- Feb: 13,630 MT = +32% YoY
- Mar: 19,382 MT = +72% YoY
- Apr: 18,986 MT = +32% YoY
- May: 24,233 MT = +39% YoY
- Jun: 26,180 MT = +62% YoY
- Jul: 24,354 MT = +53% YoY
- Aug: 21,083 MT = +8% YoY
- Sep: 21,205 MT = +33% YoY
- YTD (Jan–Sep): 181,777 MT = +36% YoY
- India:
- Jan: 4,864 MT = +68% YoY
- Feb: 4,084 MT = +15% YoY
- Mar: 4,028 MT = +25% YoY
- Apr: 3,694 MT = +10% YoY
- May: 4,800 MT = +25% YoY
- Jun: 4,251 MT = +19% YoY
- Jul: 5,505 MT = +23% YoY
- Aug: 5,788 MT = +43% YoY
- Sep: 7,051 MT = +33% YoY
- YTD (Jan–Sep): 44,066 MT = +28% YoY
- Viet Nam:
- Jan: 4,484 MT = +41% YoY
- Feb: 3,422 MT = -10% YoY
- Mar: 3,594 MT = +18% YoY
- Apr: 3,846 MT = +44% YoY
- May: 4,845 MT = +54% YoY
- Jun: 4,600 MT = +16% YoY
- Jul: 5,652 MT = +3% YoY
- Aug: 5,224 MT = -2% YoY
- Sep: 5,343 MT = -1% YoY
- YTD (Jan–Sep): 41,010 MT = +14% YoY
- Venezuela:
- Jan: 2,832 MT = -44% YoY
- Feb: 1,231 MT = -61% YoY
- Mar: 2,783 MT = -23% YoY
- Apr: 1,483 MT = -55% YoY
- May: 1,996 MT = -9% YoY
- Jun: 935 MT = -75% YoY
- Jul: 2,187 MT = -44% YoY
- Aug: 1,595 MT = -44% YoY
- Sep: 1,524 MT = -73% YoY
- YTD (Jan–Sep): 16,565 MT = -51% YoY
- Bangladesh:
- Jan: 1,464 MT = +73% YoY
- Feb: 963 MT = -16% YoY
- Mar: 938 MT = +51% YoY
- Apr: 640 MT = -10% YoY
- May: 573 MT = -10% YoY
- Jun: 653 MT = +46% YoY
- Jul: 1,706 MT = +75% YoY
- Aug: 1,739 MT = +29% YoY
- Sep: 1,865 MT = +31% YoY
- YTD (Jan–Sep): 10,540 MT = +29% YoY