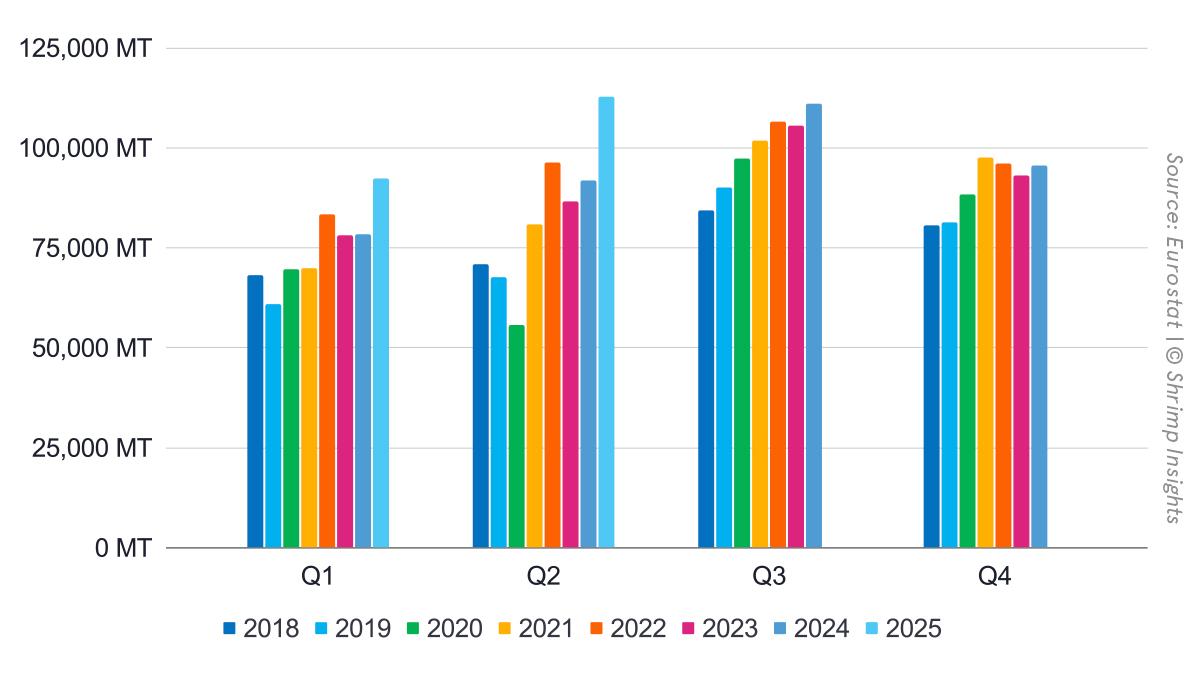
Strong Growth in Volumes and Values
In the first half of 2025, the EU imported 205,292 metric tons of raw frozen Penaeus and value-added shrimp from Asia, Latin America, and Africa, representing a 21% increase compared to the same period last year. Growth accelerated from March onwards, with particularly strong imports in May and June, both surpassing 40,000 metric tons and showing year-on-year increases of 27% and 28% respectively.
Import value grew even faster than volume. Total value reached €1.32 billion in the first six months of the year, up 29% year-on-year. The trend was consistent across months, with March standing out at €232 million (+56% YoY). June nearly matched May’s record at €245 million (+29% YoY), confirming strong momentum going into the second half of the year.
Southern and Northwestern Europe Drive Demand
Southern EU remained the dominant importing region, accounting for 128,336 metric tons in the first half of 2025, up 22% compared to last year. Growth accelerated from March, with June volumes reaching 27,244 metric tons, a 32% increase year-on-year.
Northwestern EU also showed solid growth, importing 71,381 metric tons between January and June, an increase of 20% year-on-year. While February volumes dipped slightly below 2024 levels, strong growth in March, May, and June more than offset this decline.
In contrast, Eastern EU imports remained subdued. With a total of 5,574 metric tons in the first six months, imports declined by 5% compared to last year. Monthly trends were volatile, with steep drops in February and May but a notable rebound in June when imports rose 41% year-on-year.
Raw Frozen Leads, Value-Added Steadily Expands
Raw frozen Penaeus shrimp accounted for the majority of imports. Total imports reached 179,248 metric tons in the first half of the year, up 20% year-on-year. Growth was strongest from March to June, with monthly increases of around 30% compared to 2024. June volumes of 36,108 metric tons marked a new high for the period.
Value-added shrimp products also contributed to the expansion. Imports totaled 26,044 metric tons, 23% higher than last year. January saw robust growth at +61% year-on-year, while momentum moderated in subsequent months. Even so, imports remained consistently above 4,000 metric tons per month from March onwards, showing steady demand for processed products.
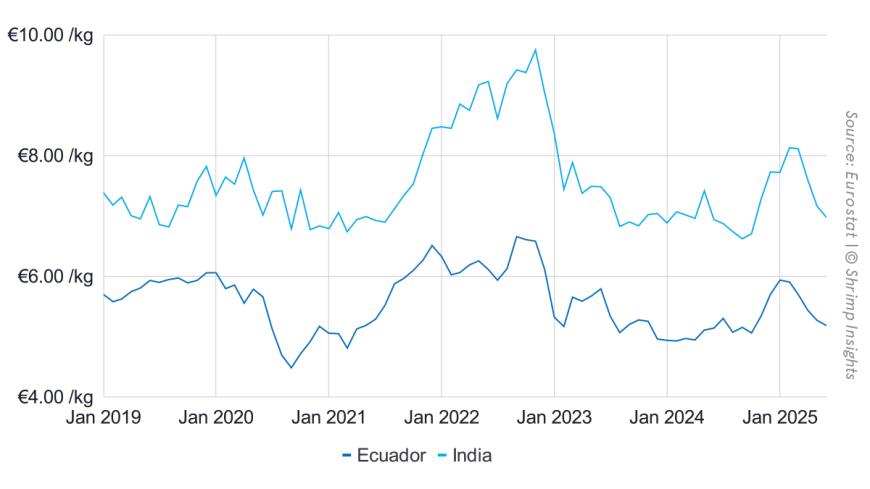
Ecuador Leads, India and Vietnam Gain, Venezuela Struggles
Ecuador remained by far the largest supplier, shipping 114,763 metric tons to the EU in the first half of 2025, a 39% increase year-on-year. After a slower January, exports surged from February onwards, with June volumes up 61% compared to last year and marking the highest monthly level so far.
India strengthened its position as the second-largest supplier, with 25,572 metric tons in the first six months, up 25% year-on-year. Growth was consistent, with volumes in every month exceeding 2024 levels.
Vietnam followed closely with 24,149 metric tons, up 22% year-on-year. Imports fluctuated, with a dip in February offset by strong growth in March, May, and June.
Venezuela experienced a sharp decline. Shipments dropped 47% year-on-year to 11,245 metric tons, with June exports collapsing to just 935 metric tons, a 75% decline compared to last year.
Bangladesh showed a mixed performance but ended the period with positive growth. Total shipments reached 5,225 metric tons, 18% above last year, though the monthly pattern was uneven, with declines in February, April, and May offset by strong rebounds in January, March, and June.
Byte in Numbers
Total Raw Frozen Penaeus (HS 03061792) and Value-Added (HS 160521, 160529) from Asia, Latin America, and Africa
- Volume:
- Jan: 30,604 MT = +8% YoY
- Feb: 26,849 MT = +8% YoY
- Mar: 34,960 MT = +39% YoY
- Apr: 31,741 MT = +12% YoY
- May: 40,547 MT = +27% YoY
- Jun: 40,590 MT = +28% YoY
- YTD (Jan–Jun): 205,292 MT = +21% YoY
- Value:
- Jan: €212 million = +26% YoY
- Feb: €184 million = +21% YoY
- Mar: €232 million = +56% YoY
- Apr: €201 million = +19% YoY
- May: €246 million = +24% YoY
- Jun: €245 million = +29% YoY
- YTD (Jan–Jun): €1,320 million = +29% YoY
Import Regions of Raw Frozen Penaeus and Value-Added from Asia, Latin America, and Africa
- Southern EU:
- Jan: 15,998 MT = -4% YoY
- Feb: 16,252 MT = +15% YoY
- Mar: 22,402 MT = +42% YoY
- Apr: 20,598 MT = +14% YoY
- May: 25,843 MT = +31% YoY
- Jun: 27,244 MT = +32% YoY
- YTD (Jan–Jun): 128,336 MT = +22% YoY
- Northwestern EU (Western Europe):
- Jan: 13,649 MT = +30% YoY
- Feb: 9,819 MT = -2% YoY
- Mar: 11,861 MT = +37% YoY
- Apr: 9,995 MT = +9% YoY
- May: 13,731 MT = +27% YoY
- Jun: 12,326 MT = +20% YoY
- YTD (Jan–Jun): 71,381 MT = +20% YoY
- Eastern EU:
- Jan: 957 MT = -14% YoY
- Feb: 779 MT = -10% YoY
- Mar: 697 MT = -16% YoY
- Apr: 1,148 MT = +15% YoY
- May: 973 MT = -28% YoY
- Jun: 1,021 MT = +41% YoY
- YTD (Jan–Jun): 5,574 MT = -5% YoY
Products
- Raw Frozen Penaeus Shrimp (HS 03061792):
- Jan: 25,929 MT = +2% YoY
- Feb: 23,090 MT = +7% YoY
- Mar: 30,990 MT = +40% YoY
- Apr: 27,518 MT = +11% YoY
- May: 35,613 MT = +29% YoY
- Jun: 36,108 MT = +31% YoY
- YTD (Jan–Jun): 179,248 MT = +20% YoY
- Value-Added (HS 160521, HS 160529):
- Jan: 4,675 MT = +61% YoY
- Feb: 3,759 MT = +12% YoY
- Mar: 3,970 MT = +26% YoY
- Apr: 4,224 MT = +24% YoY
- May: 4,934 MT = +14% YoY
- Jun: 4,482 MT = +9% YoY
- YTD (Jan–Jun): 26,044 MT = +23% YoY
Top Five Suppliers
- Ecuador:
- Jan: 12,514 MT = -3% YoY
- Feb: 13,550 MT = +31% YoY
- Mar: 19,364 MT = +72% YoY
- Apr: 19,008 MT = +32% YoY
- May: 24,188 MT = +39% YoY
- Jun: 26,138 MT = +61% YoY
- YTD (Jan–Jun): 114,763 MT = +39% YoY
- India:
- Jan: 4,848 MT = +68% YoY
- Feb: 4,084 MT = +15% YoY
- Mar: 4,006 MT = +24% YoY
- Apr: 3,608 MT = +8% YoY
- May: 4,817 MT = +25% YoY
- Jun: 4,209 MT = +18% YoY
- YTD (Jan–Jun): 25,572 MT = +25% YoY
- Vietnam:
- Jan: 4,484 MT = +41% YoY
- Feb: 3,300 MT = -13% YoY
- Mar: 3,417 MT = +13% YoY
- Apr: 3,557 MT = +33% YoY
- May: 4,791 MT = +53% YoY
- Jun: 4,600 MT = +16% YoY
- YTD (Jan–Jun): 24,149 MT = +22% YoY
- Venezuela:
- Jan: 2,811 MT = -45% YoY
- Feb: 1,231 MT = -61% YoY
- Mar: 2,788 MT = -23% YoY
- Apr: 1,483 MT = -55% YoY
- May: 1,996 MT = -9% YoY
- Jun: 935 MT = -75% YoY
- YTD (Jan–Jun): 11,245 MT = -47% YoY
- Bangladesh:
- Jan: 1,464 MT = +73% YoY
- Feb: 979 MT = -14% YoY
- Mar: 938 MT = +51% YoY
- Apr: 640 MT = -10% YoY
- May: 573 MT = -10% YoY
- Jun: 632 MT = +41% YoY
- YTD (Jan–Jun): 5,225 MT = +18% YoY