
Totals
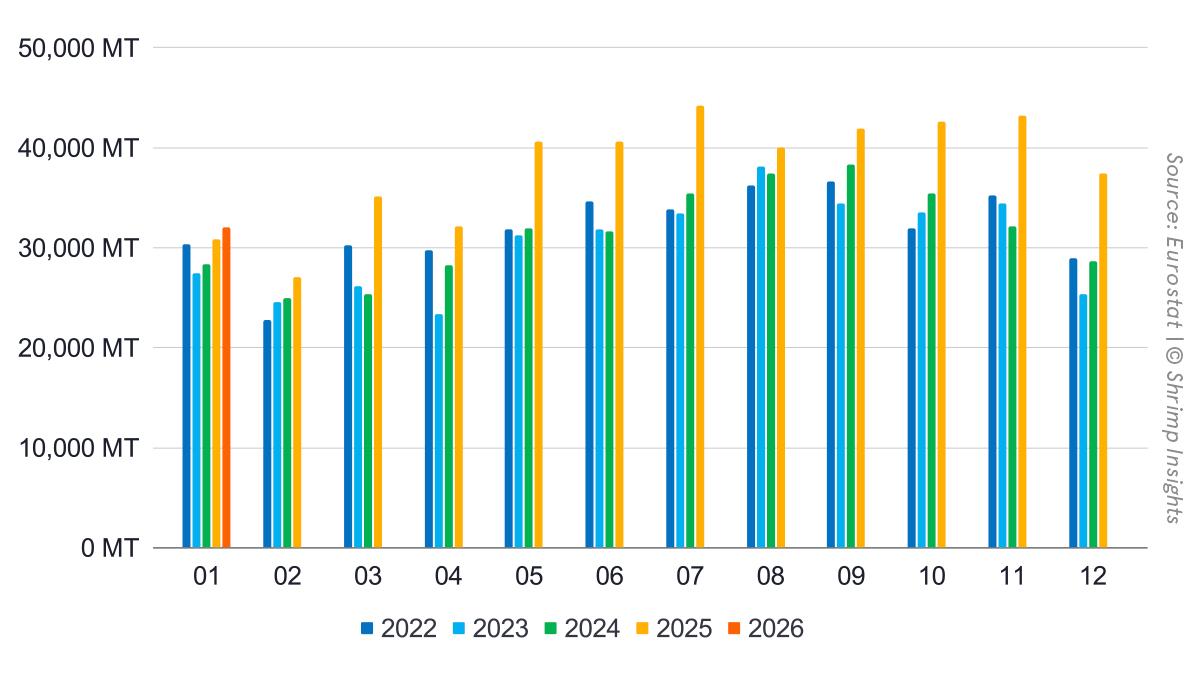
EU imports of raw frozen Penaeus (HS 03061792) and value-added shrimp (HS 160521, 160529) reached 32,049 MT in January 2026, up +4% YoY, while value declined slightly to €209 million (-2% YoY). This follows a strong 2025, when imports grew by 21% in volume and 22% in value, to 455,776 MT and €2.87 billion, respectively. The January data suggests that while underlying demand remains intact, the pace of growth has normalized after the sharp expansion seen throughout 2025. This was expected for the first few months of 2026 with another increase possible only from April or May onwards.
Regions
Regional dynamics show a clear divergence at the start of the year. Northwestern EU imports increased by +11% YoY to 15,390 MT, continuing the strong momentum seen in late 2025, particularly in Q4. In contrast, Southern EU imports declined by -4% YoY to 15,340 MT, marking a softer start after a year of consistent growth. Eastern EU continued its expansion, with imports rising by +38% YoY to 1,319 MT, albeit from a smaller base, confirming its role as a fast-growing but still secondary market within the EU. The slight drop in imports in the Southern part of the EU may reflect slightly higher inventories there compared to the Northwestern part.
Products
Product segmentation remains stable. Raw frozen Penaeus imports grew by +4% YoY to 27,306 MT in January, closely tracking the overall market. Value-added products increased by just +1% YoY to 4,744 MT, indicating limited additional momentum in this segment. Compared to 2025, when both segments expanded strongly (+21% for raw and +17% for value-added).
Suppliers
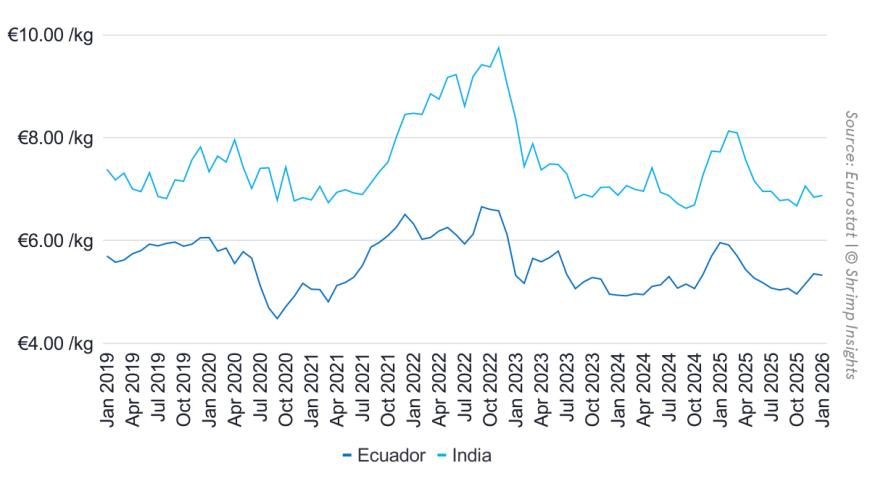
Supplier performance reflects continued structural shifts in sourcing. Ecuador maintained its dominant position, with exports rising by +4% YoY to 13,251 MT, consolidating the strong gains made in 2025 (+35% YoY). India recorded a sharp +34% YoY increase to 6,529 MT, continuing its rapid expansion in the EU market following strong growth in the second half of 2025. Vietnam also performed well, with exports up +21% YoY to 5,408 MT. In contrast, Venezuela’s exports declined by -26% YoY to 2,094 MT, extending the contraction seen in 2025 (-44% YoY), while Bangladesh also fell by -26% YoY to 1,086 MT, indicating ongoing supply-side or competitiveness challenges.
Byte in Numbers
Total Raw Frozen Penaeus (HS 03061792) and Value-Added (HS 160521, 160529) from Asia, Latin America, and Africa
- Volume:
- Feb: 27,017 MT = +8% YoY
- Mar: 35,171 MT = +39% YoY
- Apr: 32,133 MT = +14% YoY
- May: 40,620 MT = +27% YoY
- Jun: 40,616 MT = +28% YoY
- Jul: 44,245 MT = +25% YoY
- Aug: 40,051 MT = +7% YoY
- Sep: 41,878 MT = +9% YoY
- Oct: 42,584 MT = +20% YoY
- Nov: 43,179 MT = +34% YoY
- Dec: 37,460 MT = +31% YoY
- 2025 Year-Total: 455,776 MT = +21% YoY
- Jan: 32,049 MT = +4% YoY
- Value:
- Feb: €185 million = +22% YoY
- Mar: €233 million = +56% YoY
- Apr: €202 million = +20% YoY
- May: €246 million = +24% YoY
- Jun: €245 million = +30% YoY
- Jul: €271 million = +20% YoY
- Aug: €248 million = +8% YoY
- Sep: €257 million = +9% YoY
- Oct: €254 million = +14% YoY
- Nov: €271 million = +31% YoY
- Dec: €242 million = +23% YoY
- 2025 Year-Total: €2,869 million = +22% YoY
- Jan: €209 million = -2% YoY
Import Regions of Raw Frozen Penaeus and Value-Added from Asia, Latin America, and Africa
- Southern EU:
- Feb: 16,252 MT = +15% YoY
- Mar: 22,397 MT = +43% YoY
- Apr: 20,577 MT = +14% YoY
- May: 25,849 MT = +31% YoY
- Jun: 27,244 MT = +32% YoY
- Jul: 25,916 MT = +25% YoY
- Aug: 23,403 MT = +2% YoY
- Sep: 24,738 MT = +12% YoY
- Oct: 25,800 MT = +27% YoY
- Nov: 23,280 MT = +16% YoY
- Dec: 20,135 MT = +24% YoY
- 2025 Year-Total: 271,608 MT = +19% YoY
- Jan: 15,340 MT = -4% YoY
- Northwestern EU:
- Feb: 9,986 MT = -1% YoY
- Mar: 12,077 MT = +37% YoY
- Apr: 10,409 MT = +14% YoY
- May: 13,798 MT = +27% YoY
- Jun: 12,352 MT = +20% YoY
- Jul: 16,653 MT = +22% YoY
- Aug: 15,378 MT = +17% YoY
- Sep: 15,205 MT = +1% YoY
- Oct: 15,305 MT = +11% YoY
- Nov: 18,092 MT = +61% YoY
- Dec: 15,450 MT = +35% YoY
- 2025 Year-Total: 168,552 MT = +22% YoY
- Jan: 15,390 MT = +11% YoY
- Eastern EU:
- Feb: 779 MT = -10% YoY
- Mar: 697 MT = -16% YoY
- Apr: 1,148 MT = +15% YoY
- May: 973 MT = -28% YoY
- Jun: 1,021 MT = +41% YoY
- Jul: 1,676 MT = +66% YoY
- Aug: 1,270 MT = 0% YoY
- Sep: 1,935 MT = +61% YoY
- Oct: 1,479 MT = +23% YoY
- Nov: 1,807 MT = +122% YoY
- Dec: 1,875 MT = +93% YoY
- 2025 Year-Total: 15,616 MT = +26% YoY
- Jan: 1,319 MT = +38% YoY
Products
- Raw Frozen Penaeus Shrimp (HS 03061792):
- Feb: 23,272 MT = +8% YoY
- Mar: 31,158 MT = +41% YoY
- Apr: 27,820 MT = +12% YoY
- May: 35,669 MT = +29% YoY
- Jun: 36,203 MT = +31% YoY
- Jul: 38,687 MT = +27% YoY
- Aug: 35,187 MT = +7% YoY
- Sep: 36,732 MT = +9% YoY
- Oct: 37,322 MT = +21% YoY
- Nov: 38,101 MT = +37% YoY
- Dec: 32,457 MT = +34% YoY
- 2025 Year-Total: 398,750 MT = +21% YoY
- Jan: 27,306 MT = +4% YoY
- Value-Added (HS 160521, HS 160529):
- Feb: 3,745 MT = +11% YoY
- Mar: 4,013 MT = +25% YoY
- Apr: 4,313 MT = +26% YoY
- May: 4,951 MT = +14% YoY
- Jun: 4,413 MT = +8% YoY
- Jul: 5,558 MT = +13% YoY
- Aug: 4,863 MT = +10% YoY
- Sep: 5,146 MT = +15% YoY
- Oct: 5,262 MT = +13% YoY
- Nov: 5,078 MT = +14% YoY
- Dec: 5,002 MT = +12% YoY
- 2025 Year-Total: 57,026 MT = +17% YoY
- Jan: 4,744 MT = +1% YoY
Top Five Suppliers
- Ecuador:
- Feb: 13,630 MT = +32% YoY
- Mar: 19,382 MT = +72% YoY
- Apr: 18,986 MT = +32% YoY
- May: 24,233 MT = +39% YoY
- Jun: 26,174 MT = +62% YoY
- Jul: 24,498 MT = +54% YoY
- Aug: 21,083 MT = +8% YoY
- Sep: 21,240 MT = +33% YoY
- Oct: 21,997 MT = +44% YoY
- Nov: 20,770 MT = +36% YoY
- Dec: 17,230 MT = +21% YoY
- 2025 Year-Total: 241,947 MT = +35% YoY
- Jan: 13,251 MT = +4% YoY
- India:
- Feb: 4,084 MT = +15% YoY
- Mar: 4,028 MT = +23% YoY
- Apr: 3,694 MT = +10% YoY
- May: 4,800 MT = +25% YoY
- Jun: 4,251 MT = +19% YoY
- Jul: 5,519 MT = +23% YoY
- Aug: 5,818 MT = +44% YoY
- Sep: 7,083 MT = +33% YoY
- Oct: 7,372 MT = +67% YoY
- Nov: 7,785 MT = +91% YoY
- Dec: 7,543 MT = +113% YoY
- 2025 Year-Total: 66,843 MT = +44% YoY
- Jan: 6,529 MT = +34% YoY
- Viet Nam:
- Feb: 3,422 MT = -10% YoY
- Mar: 3,594 MT = +17% YoY
- Apr: 3,846 MT = +43% YoY
- May: 4,845 MT = +51% YoY
- Jun: 4,600 MT = +15% YoY
- Jul: 5,652 MT = +3% YoY
- Aug: 5,282 MT = -1% YoY
- Sep: 5,375 MT = -1% YoY
- Oct: 5,046 MT = +0% YoY
- Nov: 5,946 MT = +34% YoY
- Dec: 5,667 MT = +16% YoY
- 2025 Year-Total: 57,758 MT = +14% YoY
- Jan: 5,408 MT = +21% YoY
- Venezuela:
- Feb: 1,231 MT = -61% YoY
- Mar: 2,783 MT = -23% YoY
- Apr: 1,483 MT = -55% YoY
- May: 1,996 MT = -9% YoY
- Jun: 935 MT = -75% YoY
- Jul: 2,211 MT = -43% YoY
- Aug: 1,595 MT = -44% YoY
- Sep: 1,524 MT = -73% YoY
- Oct: 1,479 MT = -54% YoY
- Nov: 2,514 MT = +24% YoY
- Dec: 1,007 MT = +632% YoY
- 2025 Year-Total: 21,589 MT = -44% YoY
- Jan: 2,094 MT = -26% YoY
- Bangladesh:
- Feb: 963 MT = -16% YoY
- Mar: 938 MT = +43% YoY
- Apr: 640 MT = -10% YoY
- May: 573 MT = -10% YoY
- Jun: 653 MT = +46% YoY
- Jul: 1,706 MT = +72% YoY
- Aug: 1,786 MT = +31% YoY
- Sep: 1,865 MT = +28% YoY
- Oct: 1,874 MT = -13% YoY
- Nov: 1,699 MT = +4% YoY
- Dec: 1,652 MT = +1% YoY
- 2025 Year-Total: 15,813 MT = +15% YoY
- Jan: 1,086 MT = -26% YoY