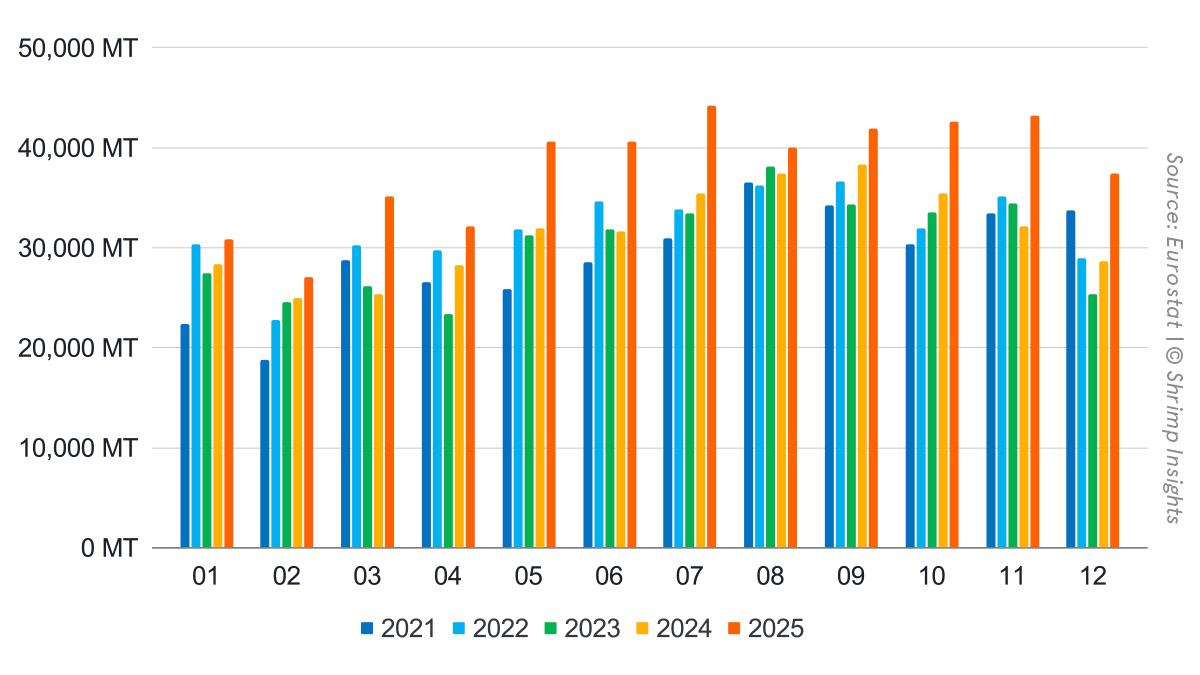
EU imports of raw frozen Penaeus (HS 03061792) and value-added shrimp (HS 160521/160529) from Asia, Latin America, and Africa totaled 455,776 MT in 2025, up 21% year-on-year. Import value rose by 22% to €2.87 billion, indicating broadly stable pricing dynamics compared to the volatility seen in previous years.
December closed the year on a particularly strong note, with imports reaching 37,460 MT, up 31% year-on-year, valued at €242 million, up 23%. After an already robust first half and steady summer performance, growth accelerated again in the fourth quarter. October, November, and December all delivered double-digit expansion, confirming that EU demand remained resilient despite macroeconomic headwinds and cautious consumer sentiment in parts of the bloc.
The overall pattern of 2025 shows consistent monthly growth from March onward, suggesting that the EU market has entered a structurally stronger demand phase rather than experiencing a temporary rebound.
Regional Breakdown
Southern Europe remained the primary engine of EU shrimp demand. Total imports reached 271,608 MT in 2025, up 19% year-on-year. December volumes stood at 20,135 MT, a 24% increase from the previous year. Growth strengthened significantly from March onward and remained consistently positive throughout the year, supported in particular by Spain and Italy. Northwestern Europe recorded even stronger relative growth. Imports reached 168,552 MT for the year, up 22% year-on-year. December volumes rose to 15,450 MT, up 35%. The final two months of the year were especially strong, with November up 61% and December up 35%. Eastern Europe, although much smaller in absolute volume, posted the highest growth rate. Imports reached 15,616 MT in 2025, up 26% year-on-year. After a weak start to the year, the region accelerated sharply in the second half. December imports rose 93% year-on-year, following triple-digit growth in November, albeit from a relatively low base.
Products
Raw frozen Penaeus shrimp (HS 03061792) continued to drive the overall expansion. Total imports reached 398,750 MT in 2025, up 21% year-on-year. December volumes stood at 32,457 MT, up 34%. Growth became particularly pronounced from March onward and remained in double digits through the remainder of the year.
Value-added products (HS 160521 and HS 160529) reached 57,026 MT in 2025, up 17% year-on-year. December volumes were 5,002 MT, up 12%. While growth in this segment was slightly more moderate than in raw product, it remained consistently positive across most months.
The somewhat lower growth rate for value-added (mainly cooked and marinated products) relative to raw frozen imports may indicate that, especially re-processors that supply the chilled retail segment, have built stocks or expanded sales, compared to suppliers of finished products to the frozen retail and wholesale segments.
Top Suppliers
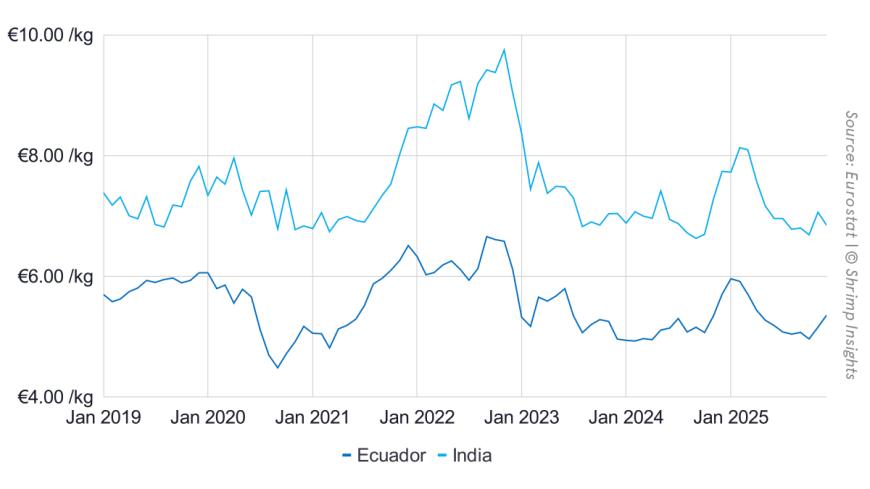
Ecuador further strengthened its dominant position in the EU market. Imports reached 241,947 MT in 2025, up 35% year-on-year. December volumes stood at 17,230 MT, up 21%. Ecuador accounted for more than half of total EU volume growth during the year. Strong double-digit increases throughout most of 2025, particularly in the first half and early fourth quarter, underline its structural expansion and competitive positioning in the European market.
India recorded the most striking acceleration. Total imports reached 66,843 MT in 2025, up 44% year-on-year. December alone saw volumes of 7,543 MT, up 113%. Growth intensified markedly in the fourth quarter, with October, November, and December all posting exceptionally strong gains. India clearly gained market share late in the year, mainly a result of its need to diversify markets amidst the US tariff situation.
Viet Nam delivered steady, moderate growth. Imports reached 57,758 MT in 2025, up 14% year-on-year. December volumes rose 16%. After a mixed mid-year performance, shipments strengthened again toward year-end, confirming stable positioning in the EU market. Venezuela experienced significant volatility and structural contraction due to the disruption of operations at LAMAR Group. Total imports fell 44% year-on-year to 21,589 MT. Although December showed an exceptional rebound, this did not offset the sharp declines recorded earlier in the year. Bangladesh recorded steady mid-sized growth, reaching 15,813 MT in 2025, up 15% year-on-year. December volumes were broadly stable, increasing marginally by 1%. Growth was strongest in the middle of the year before stabilizing in the fourth quarter.
Conclusion
The EU shrimp market delivered a remarkably strong performance in 2025, with 21% volume growth and 22% value growth. Although part of the growth may be explained by favorable exchange rate conditions, this only accounts for part of the EU’s growth in 2025. The year was characterized by broad-based regional expansion, structural strengthening of demand, and a decisive fourth-quarter acceleration.
Ecuador consolidated its leadership, India rapidly expanded its footprint—particularly in the final months—and Northwestern Europe emerged as a key driver of year-end growth. December confirmed that EU demand remained firm into the close of the year, positioning the bloc once again as a structurally important growth market for global shrimp exporters.
Byte in Numbers
Total Raw Frozen Penaeus (HS 03061792) and Value-Added (HS 160521, 160529) from Asia, Latin America, and Africa
- Volume:
- Jan: 30,823 MT = +9% YoY
- Feb: 27,017 MT = +8% YoY
- Mar: 35,171 MT = +39% YoY
- Apr: 32,133 MT = +14% YoY
- May: 40,620 MT = +27% YoY
- Jun: 40,616 MT = +28% YoY
- Jul: 44,245 MT = +25% YoY
- Aug: 40,051 MT = +7% YoY
- Sep: 41,878 MT = +9% YoY
- Oct: 42,584 MT = +20% YoY
- Nov: 43,179 MT = +34% YoY
- Dec: 37,460 MT = +31% YoY
- 2025 Year-Total: 455,776 MT = +21% YoY
- Value:
- Jan: €214 million = +26% YoY
- Feb: €185 million = +22% YoY
- Mar: €233 million = +56% YoY
- Apr: €202 million = +20% YoY
- May: €246 million = +24% YoY
- Jun: €245 million = +30% YoY
- Jul: €271 million = +20% YoY
- Aug: €248 million = +8% YoY
- Sep: €257 million = +9% YoY
- Oct: €254 million = +14% YoY
- Nov: €271 million = +31% YoY
- Dec: €242 million = +23% YoY
- 2025 Year-Total: €2,869 million = +22% YoY
Import Regions of Raw Frozen Penaeus and Value-Added from Asia, Latin America, and Africa
- Southern EU:
- Jan: 16,018 MT = -4% YoY
- Feb: 16,252 MT = +15% YoY
- Mar: 22,397 MT = +43% YoY
- Apr: 20,577 MT = +14% YoY
- May: 25,849 MT = +31% YoY
- Jun: 27,244 MT = +32% YoY
- Jul: 25,916 MT = +25% YoY
- Aug: 23,403 MT = +2% YoY
- Sep: 24,738 MT = +12% YoY
- Oct: 25,800 MT = +27% YoY
- Nov: 23,280 MT = +16% YoY
- Dec: 20,135 MT = +24% YoY
- 2025 Year-Total: 271,608 MT = +19% YoY
- Northwestern EU:
- Jan: 13,848 MT = +31% YoY
- Feb: 9,986 MT = -1% YoY
- Mar: 12,077 MT = +37% YoY
- Apr: 10,409 MT = +14% YoY
- May: 13,798 MT = +27% YoY
- Jun: 12,352 MT = +20% YoY
- Jul: 16,653 MT = +22% YoY
- Aug: 15,378 MT = +17% YoY
- Sep: 15,205 MT = +1% YoY
- Oct: 15,305 MT = +11% YoY
- Nov: 18,092 MT = +61% YoY
- Dec: 15,450 MT = +35% YoY
- 2025 Year-Total: 168,552 MT = +22% YoY
- Eastern EU:
- Jan: 957 MT = -14% YoY
- Feb: 779 MT = -10% YoY
- Mar: 697 MT = -16% YoY
- Apr: 1,148 MT = +15% YoY
- May: 973 MT = -28% YoY
- Jun: 1,021 MT = +41% YoY
- Jul: 1,676 MT = +66% YoY
- Aug: 1,270 MT = 0% YoY
- Sep: 1,935 MT = +61% YoY
- Oct: 1,479 MT = +23% YoY
- Nov: 1,807 MT = +122% YoY
- Dec: 1,875 MT = +93% YoY
- 2025 Year-Total: 15,616 MT = +26% YoY
Products
- Raw Frozen Penaeus Shrimp (HS 03061792):
- Jan: 26,143 MT = +3% YoY
- Feb: 23,272 MT = +8% YoY
- Mar: 31,158 MT = +41% YoY
- Apr: 27,820 MT = +12% YoY
- May: 35,669 MT = +29% YoY
- Jun: 36,203 MT = +31% YoY
- Jul: 38,687 MT = +27% YoY
- Aug: 35,187 MT = +7% YoY
- Sep: 36,732 MT = +9% YoY
- Oct: 37,322 MT = +21% YoY
- Nov: 38,101 MT = +37% YoY
- Dec: 32,457 MT = +34% YoY
- 2025 Year-Total: 398,750 MT = +21% YoY
- Value-Added (HS 160521, HS 160529):
- Jan: 4,680 MT = +61% YoY
- Feb: 3,745 MT = +11% YoY
- Mar: 4,013 MT = +25% YoY
- Apr: 4,313 MT = +26% YoY
- May: 4,951 MT = +14% YoY
- Jun: 4,413 MT = +8% YoY
- Jul: 5,558 MT = +13% YoY
- Aug: 4,863 MT = +10% YoY
- Sep: 5,146 MT = +15% YoY
- Oct: 5,262 MT = +13% YoY
- Nov: 5,078 MT = +14% YoY
- Dec: 5,002 MT = +12% YoY
- 2025 Year-Total: 57,026 MT = +17% YoY
Top Five Suppliers
- Ecuador:
- Jan: 12,724 MT = -2% YoY
- Feb: 13,630 MT = +32% YoY
- Mar: 19,382 MT = +72% YoY
- Apr: 18,986 MT = +32% YoY
- May: 24,233 MT = +39% YoY
- Jun: 26,174 MT = +62% YoY
- Jul: 24,498 MT = +54% YoY
- Aug: 21,083 MT = +8% YoY
- Sep: 21,240 MT = +33% YoY
- Oct: 21,997 MT = +44% YoY
- Nov: 20,770 MT = +36% YoY
- Dec: 17,230 MT = +21% YoY
- 2025 Year-Total: 241,947 MT = +35% YoY
- India:
- Jan: 4,864 MT = +65% YoY
- Feb: 4,084 MT = +15% YoY
- Mar: 4,028 MT = +23% YoY
- Apr: 3,694 MT = +10% YoY
- May: 4,800 MT = +25% YoY
- Jun: 4,251 MT = +19% YoY
- Jul: 5,519 MT = +23% YoY
- Aug: 5,818 MT = +44% YoY
- Sep: 7,083 MT = +33% YoY
- Oct: 7,372 MT = +67% YoY
- Nov: 7,785 MT = +91% YoY
- Dec: 7,543 MT = +113% YoY
- 2025 Year-Total: 66,843 MT = +44% YoY
- Viet Nam:
- Jan: 4,484 MT = +41% YoY
- Feb: 3,422 MT = -10% YoY
- Mar: 3,594 MT = +17% YoY
- Apr: 3,846 MT = +43% YoY
- May: 4,845 MT = +51% YoY
- Jun: 4,600 MT = +15% YoY
- Jul: 5,652 MT = +3% YoY
- Aug: 5,282 MT = -1% YoY
- Sep: 5,375 MT = -1% YoY
- Oct: 5,046 MT = +0% YoY
- Nov: 5,946 MT = +34% YoY
- Dec: 5,667 MT = +16% YoY
- 2025 Year-Total: 57,758 MT = +14% YoY
- Venezuela:
- Jan: 2,832 MT = -44% YoY
- Feb: 1,231 MT = -61% YoY
- Mar: 2,783 MT = -23% YoY
- Apr: 1,483 MT = -55% YoY
- May: 1,996 MT = -9% YoY
- Jun: 935 MT = -75% YoY
- Jul: 2,211 MT = -43% YoY
- Aug: 1,595 MT = -44% YoY
- Sep: 1,524 MT = -73% YoY
- Oct: 1,479 MT = -54% YoY
- Nov: 2,514 MT = +24% YoY
- Dec: 1,007 MT = +632% YoY
- 2025 Year-Total: 21,589 MT = -44% YoY
- Bangladesh:
- Jan: 1,464 MT = +70% YoY
- Feb: 963 MT = -16% YoY
- Mar: 938 MT = +43% YoY
- Apr: 640 MT = -10% YoY
- May: 573 MT = -10% YoY
- Jun: 653 MT = +46% YoY
- Jul: 1,706 MT = +72% YoY
- Aug: 1,786 MT = +31% YoY
- Sep: 1,865 MT = +28% YoY
- Oct: 1,874 MT = -13% YoY
- Nov: 1,699 MT = +4% YoY
- Dec: 1,652 MT = +1% YoY
- 2025 Year-Total: 15,813 MT = +15% YoY