Totals
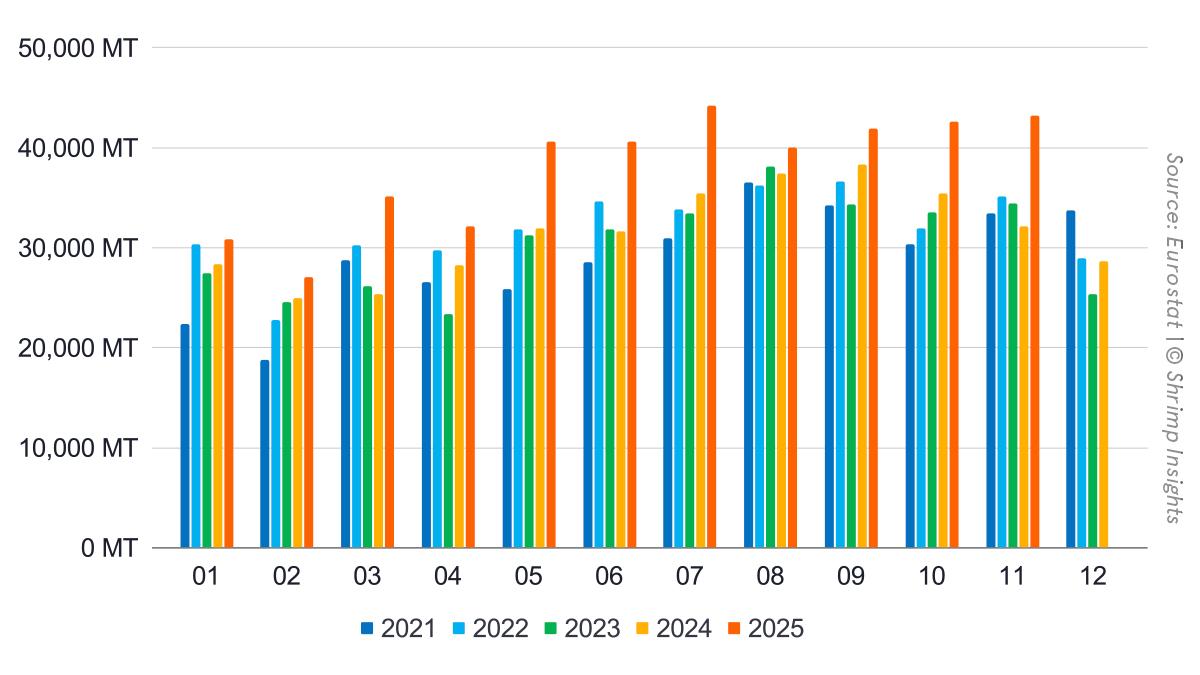
EU imports of raw frozen Penaeus shrimp (HS 03061792) and value-added shrimp (HS 160521 and 160529) from Asia, Latin America, and Africa continued their strong trajectory in November. November volumes reached 43,169 MT, up 34% year over year, making it one of the strongest months of the year and confirming the momentum already visible since spring. In value terms, November imports totaled €271 million, a 31% increase from last year, reflecting both higher volumes and a still supportive price environment. On a year-to-date basis, total imports for January to November reached 418,306 MT, up 20% year over year, while import value climbed to €2.63 billion, up 22%.
Regions
Growth in November was evident across all EU regions, but the dynamics differed noticeably. Southern EU remained the largest importing region, with November volumes of 23,280 MT, up 16% year over year, bringing YTD imports to 251,473 MT, a solid 19% increase. Northwestern EU stood out in November, posting a sharp surge to 18,082 MT, up 60% year over year, and lifting its YTD total to 153,092 MT, up 21%. This late-year acceleration suggests renewed buying activity in core markets such as the Netherlands, Belgium, and Germany after a relatively balanced summer. Eastern EU, while much smaller in absolute terms, showed the fastest relative growth, with November volumes more than doubling year over year and YTD imports reaching 13,741 MT, up 21%, highlighting the continued expansion of shrimp consumption in emerging EU markets.
Products
Raw, frozen Penaeus shrimp continued to dominate EU imports and accounted for most of the growth in 2025. November volumes reached 38,101 MT, up 37% year over year, pushing YTD imports to 366,293 MT, also up 20%. This confirms that the rebound in foodservice and retail demand is still primarily focused on core, unprocessed products. Value-added shrimp also performed well, though at a more moderate pace. November imports reached 5,068 MT, up 14% year over year, while YTD volumes totaled 52,014 MT, an increase of 17%. The steadier growth in value-added products suggests stable demand rather than a major structural shift, with processors and retailers continuing to balance cost considerations with convenience offerings.
Origins
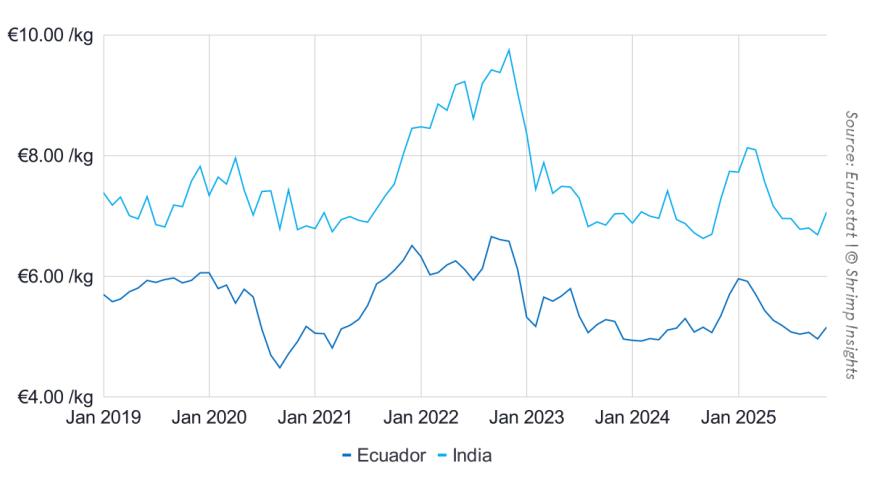
On the supply side, growth in November and YTD was highly concentrated among a few key origins. Ecuador clearly remained the main driver of EU import growth, with November shipments of 20,757 MT, up 36% year over year, and YTD volumes reaching 224,705 MT, a striking 37% increase. India also strengthened its position sharply toward year-end, posting November exports of 7,785 MT, up 91% year over year, and lifting its YTD total to 59,299 MT, up 38%, driven by a need to diversify away from the US amid the tariff situation. Vietnam showed a more moderate but still positive trend, with November volumes up 34% and YTD growth of 14%, reflecting a relatively stable year after earlier volatility. In contrast, Venezuela remained the clear outlier, with YTD exports down 47% despite a partial rebound in November, while Bangladesh delivered steady growth throughout the year, ending November with YTD volumes up 17%.
Byte in Numbers
Total Raw Frozen Penaeus (HS 03061792) and Value-Added (HS 160521, 160529) from Asia, Latin America, and Africa
- Volume:
- Jan: 30,823 MT = +9% YoY
- Feb: 27,017 MT = +8% YoY
- Mar: 35,171 MT = +39% YoY
- Apr: 32,133 MT = +14% YoY
- May: 40,620 MT = +27% YoY
- Jun: 40,616 MT = +28% YoY
- Jul: 44,245 MT = +25% YoY
- Aug: 40,051 MT = +7% YoY
- Sep: 41,878 MT = +9% YoY
- Oct: 42,584 MT = +20% YoY
- Nov: 43,169 MT = +34% YoY
- YTD (Jan–Nov): 418,306 MT = +20% YoY
- Value:
- Jan: €214 million = +26% YoY
- Feb: €185 million = +22% YoY
- Mar: €233 million = +56% YoY
- Apr: €202 million = +20% YoY
- May: €246 million = +24% YoY
- Jun: €245 million = +30% YoY
- Jul: €271 million = +20% YoY
- Aug: €248 million = +8% YoY
- Sep: €257 million = +9% YoY
- Oct: €254 million = +14% YoY
- Nov: €271 million = +31% YoY
- YTD (Jan–Nov): €2,627 million = +22% YoY
Import Regions of Raw Frozen Penaeus and Value-Added from Asia, Latin America, and Africa
- Southern EU:
- Jan: 16,018 MT = -4% YoY
- Feb: 16,252 MT = +15% YoY
- Mar: 22,397 MT = +43% YoY
- Apr: 20,577 MT = +14% YoY
- May: 25,849 MT = +31% YoY
- Jun: 27,244 MT = +32% YoY
- Jul: 25,916 MT = +25% YoY
- Aug: 23,403 MT = +2% YoY
- Sep: 24,738 MT = +12% YoY
- Oct: 25,800 MT = +27% YoY
- Nov: 23,280 MT = +16% YoY
- YTD (Jan–Nov): 251,473 MT = +19% YoY
- Northwestern EU:
- Jan: 13,848 MT = +31% YoY
- Feb: 9,986 MT = -1% YoY
- Mar: 12,077 MT = +37% YoY
- Apr: 10,409 MT = +14% YoY
- May: 13,798 MT = +27% YoY
- Jun: 12,352 MT = +20% YoY
- Jul: 16,653 MT = +22% YoY
- Aug: 15,378 MT = +17% YoY
- Sep: 15,205 MT = +1% YoY
- Oct: 15,305 MT = +11% YoY
- Nov: 18,082 MT = +60% YoY
- YTD (Jan–Nov): 153,092 MT = +21% YoY
- Eastern EU:
- Jan: 957 MT = -14% YoY
- Feb: 779 MT = -10% YoY
- Mar: 697 MT = -16% YoY
- Apr: 1,148 MT = +15% YoY
- May: 973 MT = -28% YoY
- Jun: 1,021 MT = +41% YoY
- Jul: 1,676 MT = +66% YoY
- Aug: 1,270 MT = 0% YoY
- Sep: 1,935 MT = +61% YoY
- Oct: 1,479 MT = +23% YoY
- Nov: 1,807 MT = +122% YoY
- YTD (Jan–Nov): 13,741 MT = +21% YoY
Products
- Raw Frozen Penaeus Shrimp (HS 03061792):
- Jan: 26,143 MT = +3% YoY
- Feb: 23,272 MT = +8% YoY
- Mar: 31,158 MT = +41% YoY
- Apr: 27,820 MT = +12% YoY
- May: 35,669 MT = +29% YoY
- Jun: 36,203 MT = +31% YoY
- Jul: 38,687 MT = +27% YoY
- Aug: 35,187 MT = +7% YoY
- Sep: 36,732 MT = +9% YoY
- Oct: 37,322 MT = +21% YoY
- Nov: 38,101 MT = +37% YoY
- YTD (Jan–Nov): 366,293 MT = +20% YoY
- Value-Added (HS 160521, HS 160529):
- Jan: 4,680 MT = +61% YoY
- Feb: 3,745 MT = +11% YoY
- Mar: 4,013 MT = +25% YoY
- Apr: 4,313 MT = +26% YoY
- May: 4,951 MT = +14% YoY
- Jun: 4,413 MT = +8% YoY
- Jul: 5,558 MT = +13% YoY
- Aug: 4,863 MT = +10% YoY
- Sep: 5,146 MT = +15% YoY
- Oct: 5,262 MT = +13% YoY
- Nov: 5,068 MT = +14% YoY
- YTD (Jan–Nov): 52,014 MT = +17% YoY
Top Five Suppliers
- Ecuador:
- Jan: 12,724 MT = -2% YoY
- Feb: 13,630 MT = +32% YoY
- Mar: 19,382 MT = +72% YoY
- Apr: 18,986 MT = +32% YoY
- May: 24,233 MT = +39% YoY
- Jun: 26,174 MT = +62% YoY
- Jul: 24,498 MT = +54% YoY
- Aug: 21,083 MT = +8% YoY
- Sep: 21,240 MT = +33% YoY
- Oct: 21,997 MT = +44% YoY
- Nov: 20,757 MT = +36% YoY
- YTD (Jan–Nov): 224,705 MT = +37% YoY
- India:
- Jan: 4,864 MT = +65% YoY
- Feb: 4,084 MT = +15% YoY
- Mar: 4,028 MT = +23% YoY
- Apr: 3,694 MT = +10% YoY
- May: 4,800 MT = +25% YoY
- Jun: 4,251 MT = +19% YoY
- Jul: 5,519 MT = +23% YoY
- Aug: 5,818 MT = +44% YoY
- Sep: 7,083 MT = +33% YoY
- Oct: 7,372 MT = +67% YoY
- Nov: 7,785 MT = +91% YoY
- YTD (Jan–Nov): 59,299 MT = +38% YoY
- Viet Nam:
- Jan: 4,484 MT = +41% YoY
- Feb: 3,422 MT = -10% YoY
- Mar: 3,594 MT = +17% YoY
- Apr: 3,846 MT = +43% YoY
- May: 4,845 MT = +51% YoY
- Jun: 4,600 MT = +15% YoY
- Jul: 5,652 MT = +3% YoY
- Aug: 5,282 MT = -1% YoY
- Sep: 5,375 MT = -1% YoY
- Oct: 5,046 MT = +0% YoY
- Nov: 5,938 MT = +34% YoY
- YTD (Jan–Nov): 52,084 MT = +14% YoY
- Venezuela:
- Jan: 2,832 MT = -44% YoY
- Feb: 1,231 MT = -61% YoY
- Mar: 2,783 MT = -23% YoY
- Apr: 1,483 MT = -55% YoY
- May: 1,996 MT = -9% YoY
- Jun: 935 MT = -75% YoY
- Jul: 2,211 MT = -43% YoY
- Aug: 1,595 MT = -44% YoY
- Sep: 1,524 MT = -73% YoY
- Oct: 1,479 MT = -54% YoY
- Nov: 2,514 MT = +24% YoY
- YTD (Jan–Nov): 20,582 MT = -47% YoY
- Bangladesh:
- Jan: 1,464 MT = +70% YoY
- Feb: 963 MT = -16% YoY
- Mar: 938 MT = +43% YoY
- Apr: 640 MT = -10% YoY
- May: 573 MT = -10% YoY
- Jun: 653 MT = +46% YoY
- Jul: 1,706 MT = +72% YoY
- Aug: 1,786 MT = +31% YoY
- Sep: 1,865 MT = +28% YoY
- Oct: 1,874 MT = -13% YoY
- Nov: 1,699 MT = +4% YoY
- YTD (Jan–Nov): 14,161 MT = +17% YoY