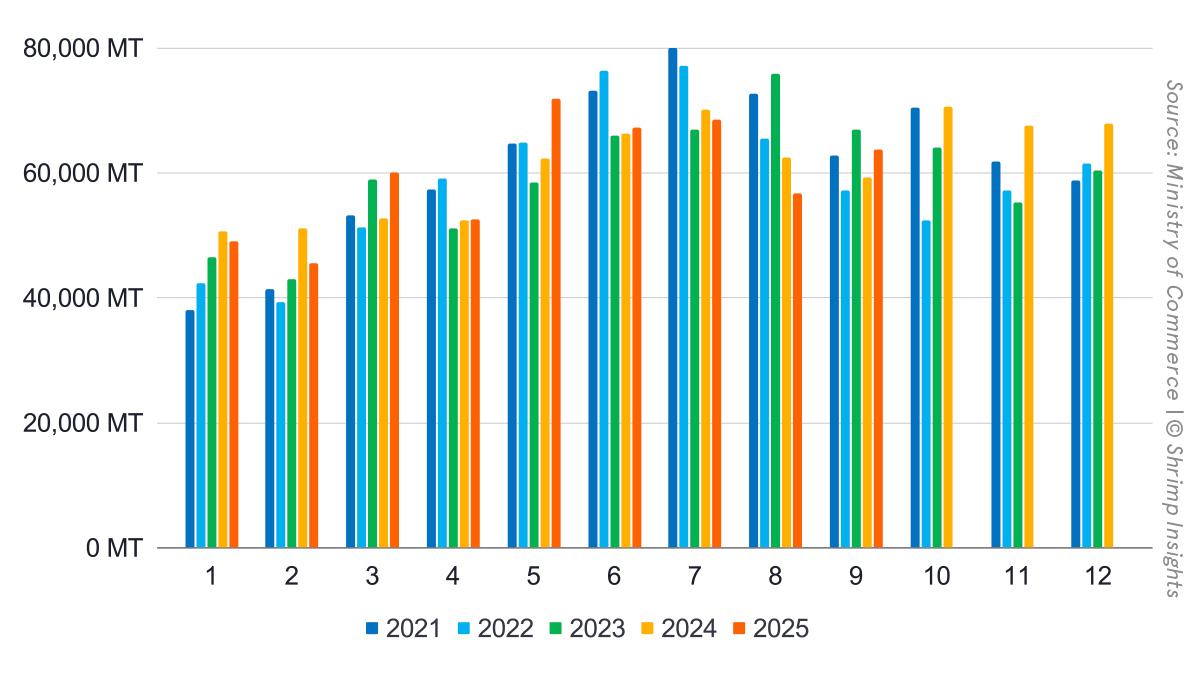
India’s shrimp exports closed the third quarter with a modest lead over last year. Total January–September exports reached 535,161 MT, 2% higher year-on-year. The first half of the year showed positive momentum, but this momentum was interrupted in July and August, which fell 2% and 9% YoY, respectively. A strong September recovery of 8% YoY brought the trend back into positive territory. Export value outperformed volume: YTD value reached USD 3.8 billion, up 10% YoY, with September alone growing 12%. This points to a gradual shift in the export basket towards higher-value products and stronger markets.
Products
Raw vannamei remained India’s core product at 409,985 MT YTD, though volumes were 2% lower year-on-year. Q3 was notably weak, with July down 5% YoY, August down 15%, and September stabilising at last year’s level. In contrast, raw monodon remained the strongest-growing category. Exports reached 28,798 MT in January–September, up 25% YoY, with massive expansions in July (+88%), August (+76%) and September (+79%). Value-added shrimp continued its steady rise, reaching 56,168 MT YTD, up 24% YoY, with September volumes up 7% YoY. Wild-caught exports totalled 40,211 MT YTD, 4% lower YoY, with Q3 remaining soft across all major destinations.
Markets
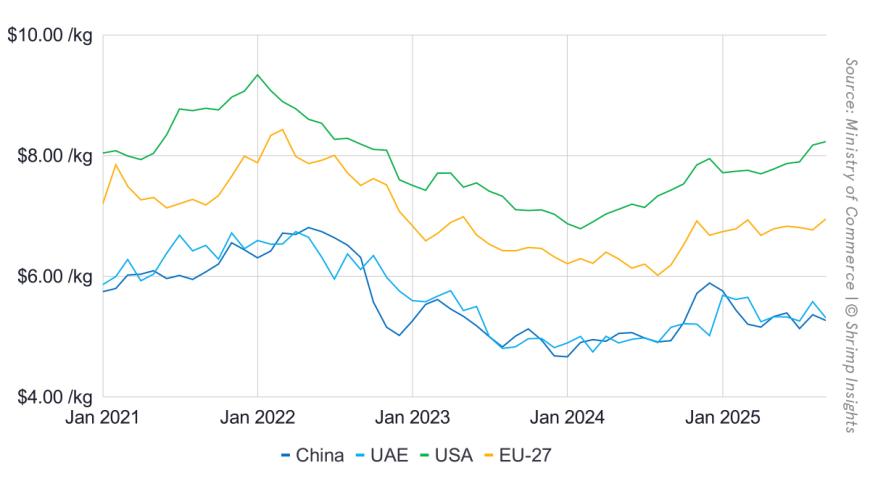
The US, still India’s largest single market, contracted sharply in the third quarter. July fell 10% YoY, August 43%, and September 33%, resulting in a 3% decline YTD to 213,992 MT. China’s demand was volatile but ended the quarter strongly, with July up 5%, August 33% and September 76% YoY, bringing the YTD total to 104,696 MT (+4% YoY). The EU-27 remained the strongest growth engine, posting 32%, 58% and 79% YoY increases in July, August and September, respectively. January–September EU volumes reached 81,243 MT, 37% higher YoY. Japan’s imports fluctuated, with a weak August but a strong September (+47% YoY), resulting in 5% YTD growth. Canada delivered consistent increases throughout Q3, ending September 37% up YoY and 12% higher YTD.
Market Breakdown by Product Category (YTD + September 2025)
India’s export composition continues to realign across regions in 2025, with the EU strengthening its position across all product categories, China driving monodon and increasingly vannamei, and North America showing pronounced declines in raw shrimp. Below is the integrated YTD and September breakdown, along with the corresponding YoY changes.
Raw L. Vannamei
India’s vannamei exports reveal a clear geographic rebalancing. North America remained the largest vannamei destination, but YTD and September volumes declined. YTD exports fell 5% YoY to 180,272 MT, and September volumes dropped 34% YoY to 14,043 MT. Within North America, exports to the US even dropped by 6% YTD, while September exports dropped by 39% YoY. Exports to Canada increased. This reflects the impact of the tariffs on trade with the US. China showed slight YTD weakness but a strong September rebound. At 88,882 MT YTD, exports were 3% lower YoY, but September reached 8,302 MT, up 46% YoY, aligning with China’s broader surge in late-Q3 Indian shrimp imports.
The EU-27 continued its exceptional expansion. Vannamei shipments to the bloc grew 50% YoY YTD to 50,518 MT and more than doubled in September, with volumes rising 133% YoY to 7,933 MT. Within the EU, especially exports to Belgium surged from 14,424 MT in 2024 to 25,620 MT in 2025. Although it is compensated by a slight drop in exports to the Netherlands, exports to the two countries combined increased by 49%. Part of this increase could be due to Dutch imports from Venezuela, which fell following the nationalisation of Lamar Group; however, this only explains part of the growth, and other companies also seem to have increased their business with Indian suppliers. Other EU countries that saw significant increases in business with India are Germany (+39%), France (+42%), Poland (+300%), Lithuania (+78%), and Portugal (+69%). But all of these markets remain relatively small compared to the Netherlands and Belgium.
Asia and Oceania remained subdued, with YTD exports down 31% to 35,445 MT and September down 19% YoY to 4,464 MT. Most apparent is the complete drop in exports to Vietnam, which had become India’s second-largest export market after China, but fell by 86% YoY in 2025. Exports to the second- and third-largest other Asian markets, Japan and Malaysia, increased by 22% and 56%, respectively.
Africa and the Middle East maintained moderate growth, with YTD volumes at 25,172 MT (+9% YoY) and September at 3,201 MT (+16% YoY). Other European markets also increased slightly, reaching 23,637 MT YTD (+5% YoY) and 2,774 MT in September (+17% YoY). Latin America remained small but grew steadily: 6,013 MT YTD (+29% YoY) and 832 MT in September (+64% YoY).
Raw P. Monodon
The monodon category remains India’s strongest growth engine, driven by China and the EU. China absorbed 13,435 MT YTD, up 150% YoY, and an exceptional 6,796 MT in September, up 169% YoY. The EU-27 sustained substantial increases as well, reaching 5,884 MT YTD (+18% YoY) and 1,479 MT in September (+51% YoY). Within the EU, exports to Belgium (46%), Germany (23%), France (10%), the Netherlands (9%), Portugal (6%) and Spain (5%) account for 99% of India's total exports. All five markets, except the Netherlands, have positive YoY growth of between 5% and 78%. The drop in the Netherlands is most likely artificial, due to Dutch importers' preference for importing through the port of Antwerp in Belgium.
Asia and Oceania recorded mixed results, with YTD volumes down 22% YoY to 3,989 MT, but September rising 36% YoY to 1,630 MT. North America reflected the general decline in raw shrimp demand: YTD monodon shipments fell 31% YoY to 3,476 MT, and September volumes declined 34% YoY to 747 MT. These drops are relatively equally shared between the US and Canada. Africa and the Middle East showed modest decreases YTD, falling to 1,764 MT (-19% YoY), though September rose slightly by 9% YoY to 362 MT. Other European destinations remained very small at 235 MT YTD (-0.5% YoY) but grew 152% YoY in September to 23 MT. Latin America remained marginal at 16 MT YTD, with small September volumes (11 MT).
Value-Added Shrimp
Value-added exports continue to demonstrate stability and broad geographic diversification. North America remained the dominant market, rising 20% YoY to 48,189 MT YTD, with September increasing slightly by 1% YoY to 5,651 MT. The US is of course by far the largest market and YTD grew by 18% but September 5% down YoY. Canada’s YTD is up by 42% and contrary to the US, September increased by 63% YoY in September.
The EU-27 remains a small market for India’s value-added exports but also expanded strongly, growing 40% YoY YTD to 3,949 MT and 38% YoY in September to 384 MT. Imports are concentrated in Belgium (38%) and France (25%), with smaller portions in Germany, the Netherlands, Italy, Lithuania and Denmark. India will undoubtedly continue to push into the EU and compete with Vietnam and Indonesia for market share.
Other European countries accounted for 2,226 MT YTD, a sharp 225% YoY increase, with September rising 93% YoY to 208 MT. Asia and Oceania grew to 664 MT YTD (+67% YoY) and 98 MT in September (+47% YoY). Latin America also increased, reaching 705 MT YTD (+3% YoY) and 84 MT in September (+192% YoY). Africa and the Middle East imported 435 MT YTD (+22% YoY) and 52 MT in September (+125% YoY). China continued to record no value-added imports from India.
Wild-Caught Shrimp
Wild-caught shrimp remains India’s weakest performing category, with declines across most regions except the EU. The EU-27 absorbed 20,892 MT YTD, up 6% YoY, and 2,078 MT in September, also up 6% YoY, confirming its position as the stabilising outlet for this product line. Asia and Oceania declined 20% YoY YTD to 10,802 MT, with September down 6% YoY to 1,593 MT.
Africa and the Middle East received 4,581 MT YTD (-13% YoY) and 568 MT in September (-38% YoY). China saw steep reductions, falling 24% YoY YTD to 2,379 MT and 53% YoY in September to just 239 MT. Latin America increased slightly to 461 MT YTD (+18% YoY) and 62 MT in September (+32% YoY). Other European markets declined to 418 MT YTD (-41% YoY) and 49 MT in September (-13% YoY). North America showed the sharpest contraction, falling 61% YoY YTD to 382 MT and 85% YoY in September to only 15 MT.
The September wild-caught total of 4,603 MT illustrates the category’s structural weakness, sustained mainly by EU demand.
Byte in Numbers
Total Shrimp Exports (HS 030617, HS 160521, HS 160529)
- Volume
- Jan: 49,058 MT = -3% YoY
- Feb: 45,487 MT = -11% YoY
- Mar: 60,113 MT = +14% YoY
- Apr: 52,475 MT = +0% YoY
- May: 71,885 MT = +15% YoY
- Jun: 67,184 MT = +1% YoY
- Jul: 68,527 MT = -2% YoY
- Aug: 56,712 MT = -9% YoY
- Sep: 63,720 MT = +8% YoY
- YTD (Jan–Sep): 535,161 MT = +2% YoY
- Value
- Jan: $355 million = +9% YoY
- Feb: $328 million = -1% YoY
- Mar: $427 million = +26% YoY
- Apr: $367 million = +9% YoY
- May: $503 million = +24% YoY
- Jun: $469 million = +10% YoY
- Jul: $491 million = +7% YoY
- Aug: $408 million = -4% YoY
- Sep: $468 million = +12% YoY
- YTD (Jan–Sep): $3,815 million = +10% YoY
Products
- Raw L. vannamei (HS 03061720)
- Jan: 35,766 MT = -8% YoY
- Feb: 33,262 MT = -15% YoY
- Mar: 46,580 MT = +14% YoY
- Apr: 42,183 MT = -2% YoY
- May: 59,241 MT = +14% YoY
- Jun: 56,157 MT = -0% YoY
- Jul: 54,970 MT = -5% YoY
- Aug: 40,250 MT = -15% YoY
- Sep: 41,575 MT = -0% YoY
- YTD (Jan–Sep): 409,985 MT = -2% YoY
- Raw P. monodon (HS 03061740)
- Jan: 2,425 MT = -0% YoY
- Feb: 1,230 MT = -47% YoY
- Mar: 1,444 MT = -28% YoY
- Apr: 1,153 MT = -31% YoY
- May: 1,199 MT = -34% YoY
- Jun: 900 MT = -36% YoY
- Jul: 2,807 MT = +88% YoY
- Aug: 6,591 MT = +76% YoY
- Sep: 11,048 MT = +79% YoY
- YTD (Jan–Sep): 28,798 MT = +25% YoY
- Value-Added (HS 160521, HS 160529)
- Jan: 5,631 MT = +38% YoY
- Feb: 6,055 MT = +31% YoY
- Mar: 6,563 MT = +41% YoY
- Apr: 4,921 MT = +27% YoY
- May: 7,341 MT = +54% YoY
- Jun: 6,764 MT = +33% YoY
- Jul: 7,012 MT = +17% YoY
- Aug: 5,403 MT = -10% YoY
- Sep: 6,477 MT = +7% YoY
- YTD (Jan–Sep): 56,168 MT = +24% YoY
- Raw Wild-Caught (HS 03061711/19/30/50/90)
- Jan: 5,236 MT = -0% YoY
- Feb: 4,939 MT = -5% YoY
- Mar: 5,525 MT = +8% YoY
- Apr: 4,218 MT = +15% YoY
- May: 4,103 MT = +12% YoY
- Jun: 3,362 MT = -3% YoY
- Jul: 3,737 MT = -22% YoY
- Aug: 4,469 MT = -19% YoY
- Sep: 4,620 MT = -13% YoY
- YTD (Jan–Sep): 40,211 MT = -4% YoY
Top 5 Markets
- USA
- Jan: 21,724 MT = +6% YoY
- Feb: 21,813 MT = -3% YoY
- Mar: 26,794 MT = +32% YoY
- Apr: 22,651 MT = +14% YoY
- May: 32,810 MT = +28% YoY
- Jun: 26,627 MT = +5% YoY
- Jul: 27,517 MT = -10% YoY
- Aug: 16,495 MT = -43% YoY
- Sep: 17,562 MT = -33% YoY
- YTD (Jan–Sep): 213,992 MT = -3% YoY
- China
- Jan: 5,247 MT = -45% YoY
- Feb: 5,112 MT = -40% YoY
- Mar: 10,908 MT = +13% YoY
- Apr: 10,286 MT = -12% YoY
- May: 17,337 MT = +20% YoY
- Jun: 16,187 MT = -5% YoY
- Jul: 12,092 MT = +5% YoY
- Aug: 12,190 MT = +33% YoY
- Sep: 15,337 MT = +76% YoY
- YTD (Jan–Sep): 104,696 MT = +4% YoY
- EU
- Jan: 7,303 MT = +21% YoY
- Feb: 7,537 MT = +27% YoY
- Mar: 8,297 MT = +17% YoY
- Apr: 7,822 MT = +36% YoY
- May: 8,060 MT = +24% YoY
- Jun: 8,488 MT = +33% YoY
- Jul: 10,780 MT = +32% YoY
- Aug: 11,083 MT = +58% YoY
- Sep: 11,873 MT = +79% YoY
- YTD (Jan–Sep): 81,243 MT = +37% YoY
- Japan
- Jan: 2,299 MT = -14% YoY
- Feb: 2,005 MT = -9% YoY
- Mar: 3,210 MT = +46% YoY
- Apr: 2,435 MT = +35% YoY
- May: 3,152 MT = +8% YoY
- Jun: 3,322 MT = -11% YoY
- Jul: 4,512 MT = +0% YoY
- Aug: 4,220 MT = -20% YoY
- Sep: 5,286 MT = +47% YoY
- YTD (Jan–Sep): 30,440 MT = +5% YoY
- Canada
- Jan: 1,399 MT = -17% YoY
- Feb: 1,566 MT = -15% YoY
- Mar: 2,303 MT = +29% YoY
- Apr: 2,059 MT = +27% YoY
- May: 1,809 MT = +20% YoY
- Jun: 1,798 MT = +19% YoY
- Jul: 2,128 MT = +3% YoY
- Aug: 2,355 MT = +6% YoY
- Sep: 2,852 MT = +37% YoY
- YTD (Jan–Sep): 18,267 MT = +12% YoY