
Totals
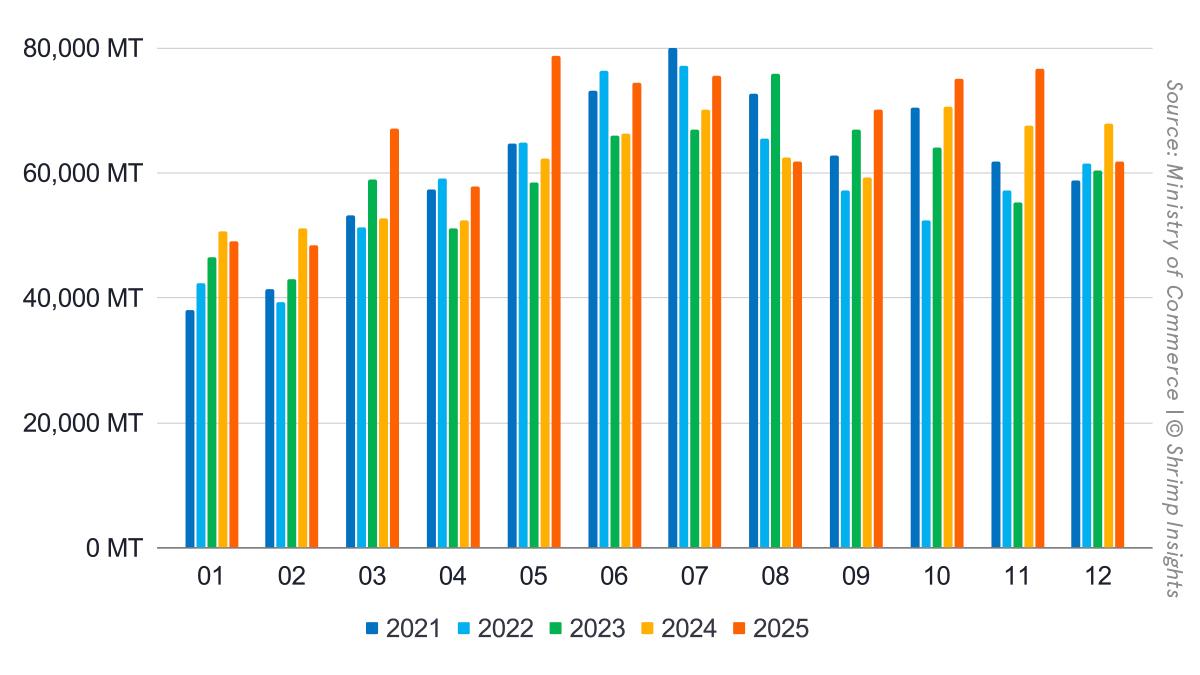
India’s total shrimp exports (HS 030617, 160521, 160529) reached 796,374 MT in 2025, up 9% year-on-year, while export value increased 14% to $5.66 billion. After a soft start in January and February, shipments accelerated strongly from March through July, with May marking the peak month at 78,753 MT. Momentum moderated in the second half of the year, but volumes remained structurally higher than 2024 levels.
December closed the year weaker, at 61,781 MT, down 9% YoY, with value falling 12% to $437 million. The December decline was largely driven by reduced US buying, while other markets continued to show relative resilience.
The intra-year pattern clearly reflects preloading into the US market ahead of reciprocal tariff measures, followed by a sharp correction from August onwards. That correction, however, did not derail the annual growth story, as India successfully redirected volumes into alternative markets.
Products
Raw L. vannamei remained the backbone of India’s exports, totaling 605,966 MT in 2025, up 7% YoY. Growth was concentrated in the March–July window. December volumes declined 13% YoY to 43,584 MT, reflecting weaker US demand.
Value-added exports expanded faster than raw shrimp, increasing 14% YoY to 76,389 MT. The first half of the year showed particularly strong growth, with double-digit gains nearly every month. December volumes fell 15% YoY to 6,020 MT, mirroring the broader slowdown in the US market.
Wild-caught shrimp declined 4% YoY to 57,431 MT for the year, continuing its structural contraction. December volumes were down 9% YoY.
Raw P. monodon was the standout category, rising 36% YoY to 56,587 MT. After a weak first half, shipments accelerated sharply from July onwards, with triple-digit growth rates in late summer and early autumn. December volumes remained 43% above last year.
Top Five Markets
The United States remained India’s largest market but contracted 9% YoY to 276,348 MT. The year shows a clear two-phase pattern: strong growth through May, including a peak of 32,931 MT in May, followed by a steep decline from August onward. December shipments fell 37% YoY to 17,599 MT. This reflects the impact of US reciprocal tariff measures, which triggered preloading in the first half and subsequent demand compression in the second half.
China increased imports from India by 10% YoY to 154,291 MT. After a weak start to the year, volumes accelerated from May onward. December shipments were up 16% YoY, confirming China’s role as a stabilizing alternative destination in the second half. P. Monodon played a significant role in China’s appetite for Indian shrimp. China imported over 50% of total Indian P. Monodon output in 2025.
EU-27 imports surged 39% YoY to 119,748 MT, making it the fastest-growing large Western market for Indian shrimp. Growth was consistent throughout the year, with double-digit increases nearly every month. December volumes reached 12,099 MT, up 51% YoY, highlighting strong structural diversification toward Europe.
Vietnam expanded imports from India by 61% YoY to 69,292 MT. Much of this likely reflects reprocessing and regional trade flows. December volumes declined 31% YoY, but the full-year growth remains substantial.
Japan grew modestly by 6% YoY to 40,643 MT. December shipments were down 10% YoY, but overall performance was relatively stable compared to the volatility seen in the US market.
Byte in Numbers
Total Shrimp Exports (HS 030617, HS 160521, HS 160529)
- Volume:
- Jan: 49,058 MT = -3% YoY
- Feb: 48,383 MT = -5% YoY
- Mar: 67,022 MT = +27% YoY
- Apr: 57,800 MT = +10% YoY
- May: 78,753 MT = +26% YoY
- Jun: 74,405 MT = +12% YoY
- Jul: 75,508 MT = +8% YoY
- Aug: 61,842 MT = -1% YoY
- Sep: 70,121 MT = +18% YoY
- Oct: 75,085 MT = +6% YoY
- Nov: 76,616 MT = +13% YoY
- Dec: 61,781 MT = -9% YoY
- 2025 Year-Total: 796,374 MT = +9% YoY
- Value:
- Jan: $355 million = +9% YoY
- Feb: $348 million = +5% YoY
- Mar: $471 million = +39% YoY
- Apr: $401 million = +19% YoY
- May: $547 million = +35% YoY
- Jun: $513 million = +20% YoY
- Jul: $533 million = +16% YoY
- Aug: $440 million = +3% YoY
- Sep: $508 million = +21% YoY
- Oct: $569 million = +13% YoY
- Nov: $543 million = +11% YoY
- Dec: $437 million = -12% YoY
- 2025 Year-Total: $5,664 million = +14% YoY
Products
- Raw L. vannamei:
- Jan: 35,786 MT = -8% YoY
- Feb: 36,001 MT = -8% YoY
- Mar: 53,286 MT = +30% YoY
- Apr: 47,291 MT = +10% YoY
- May: 65,863 MT = +26% YoY
- Jun: 63,133 MT = +12% YoY
- Jul: 61,609 MT = +7% YoY
- Aug: 44,932 MT = -5% YoY
- Sep: 47,383 MT = +14% YoY
- Oct: 52,115 MT = +7% YoY
- Nov: 54,985 MT = +11% YoY
- Dec: 43,584 MT = -13% YoY
- 2025 Year-Total: 605,966 MT = +7% YoY
- Value-added:
- Jan: 5,631 MT = +38% YoY
- Feb: 6,064 MT = +31% YoY
- Mar: 6,598 MT = +41% YoY
- Apr: 4,937 MT = +27% YoY
- May: 7,342 MT = +54% YoY
- Jun: 6,787 MT = +33% YoY
- Jul: 7,012 MT = +17% YoY
- Aug: 5,403 MT = -10% YoY
- Sep: 6,486 MT = +7% YoY
- Oct: 7,033 MT = -4% YoY
- Nov: 7,077 MT = -1% YoY
- Dec: 6,020 MT = -15% YoY
- 2025 Year-Total: 76,389 MT = +14% YoY
- Wild-caught:
- Jan: 5,216 MT = -0% YoY
- Feb: 5,042 MT = -3% YoY
- Mar: 5,664 MT = +11% YoY
- Apr: 4,347 MT = +18% YoY
- May: 4,225 MT = +15% YoY
- Jun: 3,444 MT = -1% YoY
- Jul: 3,930 MT = -18% YoY
- Aug: 4,669 MT = -16% YoY
- Sep: 4,780 MT = -10% YoY
- Oct: 5,575 MT = -12% YoY
- Nov: 5,185 MT = -7% YoY
- Dec: 5,355 MT = -9% YoY
- 2025 Year-Total: 57,431 MT = -4% YoY
- Raw P. monodon:
- Jan: 2,425 MT = -0% YoY
- Feb: 1,276 MT = -45% YoY
- Mar: 1,475 MT = -26% YoY
- Apr: 1,225 MT = -27% YoY
- May: 1,323 MT = -27% YoY
- Jun: 1,042 MT = -26% YoY
- Jul: 2,958 MT = +99% YoY
- Aug: 6,839 MT = +83% YoY
- Sep: 11,471 MT = +85% YoY
- Oct: 10,361 MT = +25% YoY
- Nov: 9,369 MT = +73% YoY
- Dec: 6,822 MT = +43% YoY
- 2025 Year-Total: 56,587 MT = +36% YoY
Top Five Markets
- USA:
- Jan: 21,724 MT = +6% YoY
- Feb: 21,896 MT = -3% YoY
- Mar: 26,886 MT = +32% YoY
- Apr: 22,760 MT = +14% YoY
- May: 32,931 MT = +28% YoY
- Jun: 26,693 MT = +5% YoY
- Jul: 27,578 MT = -9% YoY
- Aug: 16,587 MT = -42% YoY
- Sep: 17,610 MT = -33% YoY
- Oct: 21,405 MT = -26% YoY
- Nov: 22,257 MT = -18% YoY
- Dec: 17,599 MT = -37% YoY
- 2025 Year-Total: 276,348 MT = -9% YoY
- China:
- Jan: 5,247 MT = -45% YoY
- Feb: 5,112 MT = -40% YoY
- Mar: 10,908 MT = +13% YoY
- Apr: 10,286 MT = -12% YoY
- May: 17,337 MT = +20% YoY
- Jun: 16,187 MT = -5% YoY
- Jul: 12,092 MT = +5% YoY
- Aug: 12,190 MT = +33% YoY
- Sep: 15,337 MT = +76% YoY
- Oct: 16,161 MT = +18% YoY
- Nov: 20,146 MT = +42% YoY
- Dec: 13,289 MT = +16% YoY
- 2025 Year-Total: 154,291 MT = +10% YoY
- EU-27:
- Jan: 7,303 MT = +21% YoY
- Feb: 7,537 MT = +27% YoY
- Mar: 8,297 MT = +17% YoY
- Apr: 7,822 MT = +36% YoY
- May: 8,060 MT = +24% YoY
- Jun: 8,488 MT = +33% YoY
- Jul: 10,780 MT = +32% YoY
- Aug: 11,083 MT = +58% YoY
- Sep: 11,873 MT = +79% YoY
- Oct: 11,873 MT = +79% YoY
- Nov: 12,305 MT = +58% YoY
- Dec: 12,099 MT = +51% YoY
- 2025 Year-Total: 119,748 MT = +39% YoY
- Vietnam:
- Jan: 3,568 MT = +30% YoY
- Feb: 2,805 MT = +30% YoY
- Mar: 6,755 MT = +89% YoY
- Apr: 5,180 MT = +50% YoY
- May: 6,747 MT = +131% YoY
- Jun: 7,133 MT = +97% YoY
- Jul: 6,901 MT = +140% YoY
- Aug: 5,038 MT = +264% YoY
- Sep: 6,343 MT = +86% YoY
- Oct: 6,727 MT = +90% YoY
- Nov: 6,826 MT = +21% YoY
- Dec: 5,270 MT = -31% YoY
- 2025 Year-Total: 69,292 MT = +61% YoY
- Japan:
- Jan: 2,299 MT = -14% YoY
- Feb: 2,005 MT = -9% YoY
- Mar: 3,210 MT = +46% YoY
- Apr: 2,435 MT = +35% YoY
- May: 3,152 MT = +8% YoY
- Jun: 3,322 MT = -11% YoY
- Jul: 4,512 MT = +0% YoY
- Aug: 4,220 MT = -20% YoY
- Sep: 5,286 MT = +47% YoY
- Oct: 4,100 MT = +9% YoY
- Nov: 3,157 MT = +23% YoY
- Dec: 2,946 MT = -10% YoY
- 2025 Year-Total: 40,643 MT = +6% YoY