Total Exports: Solid October, Strong YTD Momentum
India’s shrimp exports continued to expand in October, but the headline growth increasingly reflects a shift in market mix rather than broad-based strength.
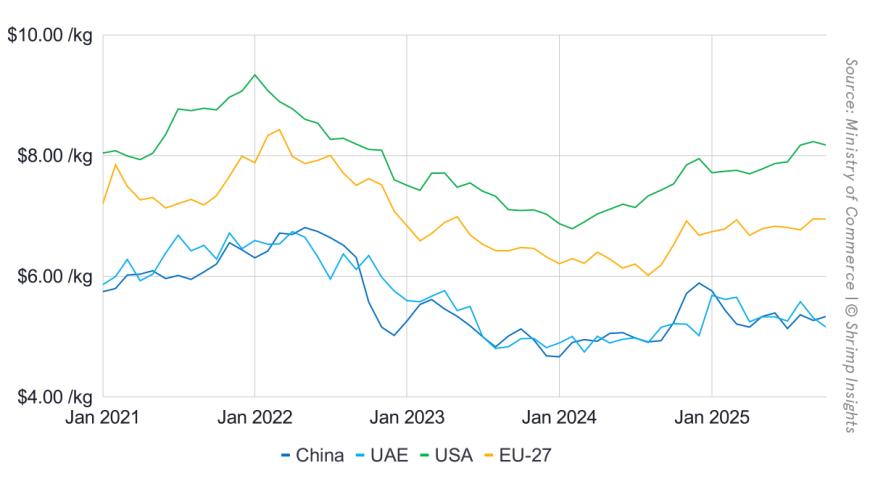
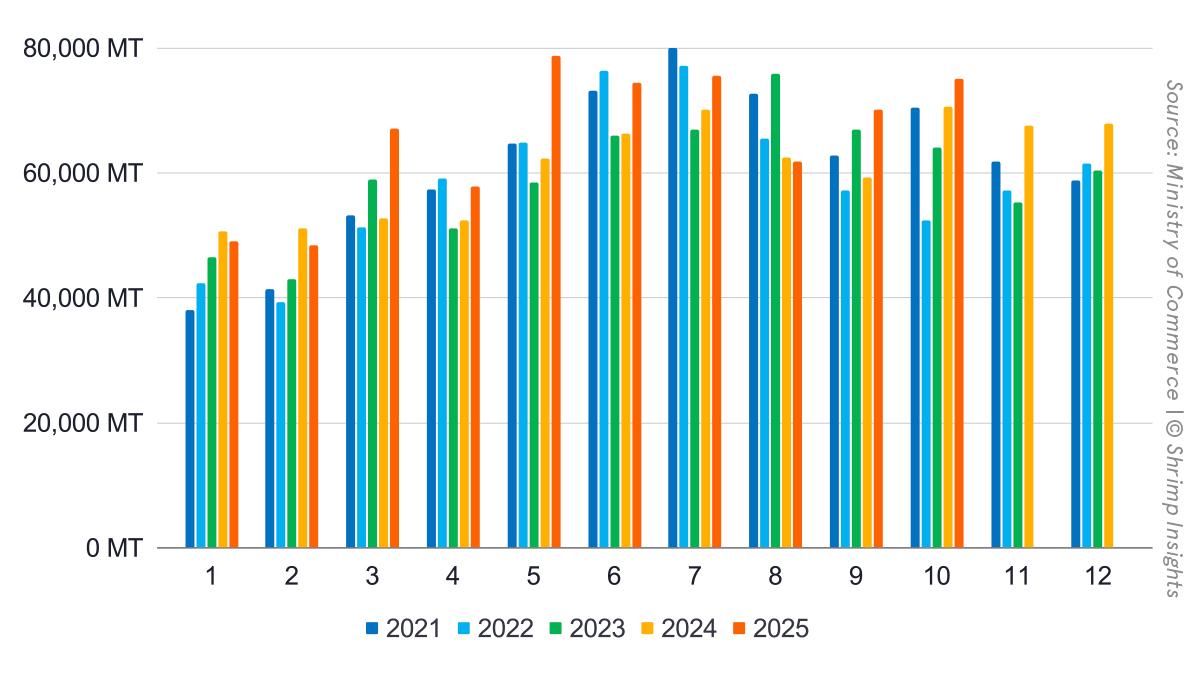
Total exports reached 75,085 MT in October, up 6% year-on-year, while export value climbed faster, to USD 569 million (+13% YoY). This confirms the trend seen throughout 2025: value growth consistently outpacing volume, driven by firmer prices and a gradual tilt towards higher-value products and markets.
On a cumulative basis, January–October exports reached 657,977 MT, up 10% YoY, with total export value at USD 4.68 billion (+18% YoY). After a weak start to the year in January–February, exports rebounded sharply from March onwards, with only a brief pause in August before regaining momentum in September and October.
Products: Monodon and Value-Added Drive the Upside
Product trends remain clearly differentiated.
Raw L. vannamei remains the backbone of India’s export basket. October volumes reached 52,115 MT (+7% YoY), bringing YTD shipments to 507,397 MT (+9% YoY). Growth is steady rather than spectacular, but stability in vannamei continues to underpin overall export performance.
Value-added shrimp showed mixed signals in October. Volumes slipped slightly to 7,033 MT (-4% YoY), yet the broader trend remains positive, with YTD exports up 21% YoY at 63,292 MT. This suggests temporary volatility rather than a structural slowdown, with processors still prioritising value recovery.
Raw P. monodon is the standout story of 2025. October exports reached 10,361 MT (+25% YoY), following exceptionally strong growth since July. Year-to-date volumes are up 29% YoY at 40,396 MT, reflecting renewed demand from premium markets and tighter global monodon availability.
Wild-caught shrimp continues to lag, with October volumes down 12% YoY and YTD exports at 46,891 MT (-3% YoY), reinforcing the structural decline of this segment.
Markets: US Weakness Offset by Asia and Europe
Market dynamics are increasingly uneven, with a clear rebalancing away from the United States.
United States. October exports fell to 21,405 MT (-26% YoY), marking the third consecutive month of sharp decline. On a YTD basis, shipments to the US are now down 5% YoY at 236,069 MT. This downturn closely aligns with the introduction and anticipation of reciprocal tariffs, which have eroded India’s competitiveness in the US market and prompted exporters to redirect volumes elsewhere.
China. October exports reached 16,161 MT (+18% YoY), lifting YTD shipments to 120,856 MT (+6% YoY). Growth accelerated notably in the second half of the year, supported by strong demand for raw material and reprocessing.
EU-27. Europe remains one of the strongest growth engines. October volumes reached 11,873 MT (+79% YoY), identical to September’s level, pushing YTD exports up 37% YoY to 81,243 MT. The EU is clearly absorbing part of the volume displaced from the US.
Vietnam. Exports to Vietnam continued their extraordinary expansion, with October volumes up 90% YoY at 6,727 MT. Year-to-date shipments reached 57,196 MT (+93% YoY), underlining Vietnam’s growing role as a reprocessing hub for Indian shrimp.
Japan. October exports rose modestly to 4,100 MT (+9% YoY), bringing YTD growth to 6% YoY. Japan remains stable but secondary compared to the rapid expansion seen in Europe and intra-Asia trade.
Bottom Line
October confirms that India’s shrimp export growth in 2025 is increasingly about where product is sold rather than how much is produced. While overall volumes and values remain firmly positive year to date, the sharp and persistent decline in shipments to the US—closely linked to reciprocal tariffs—is reshaping trade flows. Europe, China and Vietnam are absorbing much of this displaced volume, while monodon and value-added products continue to support export value growth.
Byte in Numbers
Total Shrimp Exports (HS 030617, HS 160521, HS 160529)
- Volume:
- Jan: 49,058 MT = -3% YoY
- Feb: 48,383 MT = -5% YoY
- Mar: 67,022 MT = +27% YoY
- Apr: 57,800 MT = +10% YoY
- May: 78,753 MT = +26% YoY
- Jun: 74,405 MT = +12% YoY
- Jul: 75,508 MT = +8% YoY
- Aug: 61,842 MT = -1% YoY
- Sep: 70,121 MT = +18% YoY
- Oct: 75,085 MT = +6% YoY
- YTD (Jan–Oct): 657,977 MT = +10% YoY
- Value:
- Jan: $355 million = +9% YoY
- Feb: $348 million = +5% YoY
- Mar: $471 million = +39% YoY
- Apr: $401 million = +19% YoY
- May: $547 million = +35% YoY
- Jun: $513 million = +20% YoY
- Jul: $533 million = +16% YoY
- Aug: $440 million = +3% YoY
- Sep: $508 million = +21% YoY
- Oct: $569 million = +13% YoY
- YTD (Jan–Oct): $4,684 million = +18% YoY
Products
- Raw L. vannamei:
- Jan: 35,786 MT = -8% YoY
- Feb: 36,001 MT = -8% YoY
- Mar: 53,286 MT = +30% YoY
- Apr: 47,291 MT = +10% YoY
- May: 65,863 MT = +26% YoY
- Jun: 63,133 MT = +12% YoY
- Jul: 61,609 MT = +7% YoY
- Aug: 44,932 MT = -5% YoY
- Sep: 47,383 MT = +14% YoY
- Oct: 52,115 MT = +7% YoY
- YTD (Jan–Oct): 507,397 MT = +9% YoY
- Value-added:
- Jan: 5,631 MT = +38% YoY
- Feb: 6,064 MT = +31% YoY
- Mar: 6,598 MT = +41% YoY
- Apr: 4,937 MT = +27% YoY
- May: 7,342 MT = +54% YoY
- Jun: 6,787 MT = +33% YoY
- Jul: 7,012 MT = +17% YoY
- Aug: 5,403 MT = -10% YoY
- Sep: 6,486 MT = +7% YoY
- Oct: 7,033 MT = -4% YoY
- YTD (Jan–Oct): 63,292 MT = +21% YoY
- Wild-caught:
- Jan: 5,216 MT = -0% YoY
- Feb: 5,042 MT = -3% YoY
- Mar: 5,664 MT = +11% YoY
- Apr: 4,347 MT = +18% YoY
- May: 4,225 MT = +15% YoY
- Jun: 3,444 MT = -1% YoY
- Jul: 3,930 MT = -18% YoY
- Aug: 4,669 MT = -16% YoY
- Sep: 4,780 MT = -10% YoY
- Oct: 5,575 MT = -12% YoY
- YTD (Jan–Oct): 46,891 MT = -3% YoY
- Raw P. monodon:
- Jan: 2,425 MT = -0% YoY
- Feb: 1,276 MT = -45% YoY
- Mar: 1,475 MT = -26% YoY
- Apr: 1,225 MT = -27% YoY
- May: 1,323 MT = -27% YoY
- Jun: 1,042 MT = -26% YoY
- Jul: 2,958 MT = +99% YoY
- Aug: 6,839 MT = +83% YoY
- Sep: 11,471 MT = +85% YoY
- Oct: 10,361 MT = +25% YoY
- YTD (Jan–Oct): 40,396 MT = +29% YoY
Top 5 Markets
- USA:
- Jan: 21,724 MT = +6% YoY
- Feb: 21,896 MT = -3% YoY
- Mar: 26,886 MT = +32% YoY
- Apr: 22,760 MT = +14% YoY
- May: 32,931 MT = +28% YoY
- Jun: 26,693 MT = +5% YoY
- Jul: 27,578 MT = -9% YoY
- Aug: 16,587 MT = -42% YoY
- Sep: 17,610 MT = -33% YoY
- Oct: 21,405 MT = -26% YoY
- YTD (Jan–Oct): 236,069 MT = -5% YoY
- China:
- Jan: 5,247 MT = -45% YoY
- Feb: 5,112 MT = -40% YoY
- Mar: 10,908 MT = +13% YoY
- Apr: 10,286 MT = -12% YoY
- May: 17,337 MT = +20% YoY
- Jun: 16,187 MT = -5% YoY
- Jul: 12,092 MT = +5% YoY
- Aug: 12,190 MT = +33% YoY
- Sep: 15,337 MT = +76% YoY
- Oct: 16,161 MT = +18% YoY
- YTD (Jan–Oct): 120,856 MT = +6% YoY
- EU-27:
- Jan: 7,303 MT = +21% YoY
- Feb: 7,537 MT = +27% YoY
- Mar: 8,297 MT = +17% YoY
- Apr: 7,822 MT = +36% YoY
- May: 8,060 MT = +24% YoY
- Jun: 8,488 MT = +33% YoY
- Jul: 10,780 MT = +32% YoY
- Aug: 11,083 MT = +58% YoY
- Sep: 11,873 MT = +79% YoY
- Oct: 11,873 MT = +79% YoY
- YTD (Jan–Oct): 81,243 MT = +37% YoY
- Vietnam:
- Jan: 3,568 MT = +30% YoY
- Feb: 2,805 MT = +30% YoY
- Mar: 6,755 MT = +89% YoY
- Apr: 5,180 MT = +50% YoY
- May: 6,747 MT = +131% YoY
- Jun: 7,133 MT = +97% YoY
- Jul: 6,901 MT = +140% YoY
- Aug: 5,038 MT = +264% YoY
- Sep: 6,343 MT = +86% YoY
- Oct: 6,727 MT = +90% YoY
- YTD (Jan–Oct): 57,196 MT = +93% YoY
- Japan:
- Jan: 2,299 MT = -14% YoY
- Feb: 2,005 MT = -9% YoY
- Mar: 3,210 MT = +46% YoY
- Apr: 2,435 MT = +35% YoY
- May: 3,152 MT = +8% YoY
- Jun: 3,322 MT = -11% YoY
- Jul: 4,512 MT = +0% YoY
- Aug: 4,220 MT = -20% YoY
- Sep: 5,286 MT = +47% YoY
- Oct: 4,100 MT = +9% YoY
- YTD (Jan–Oct): 34,540 MT = +6% YoY