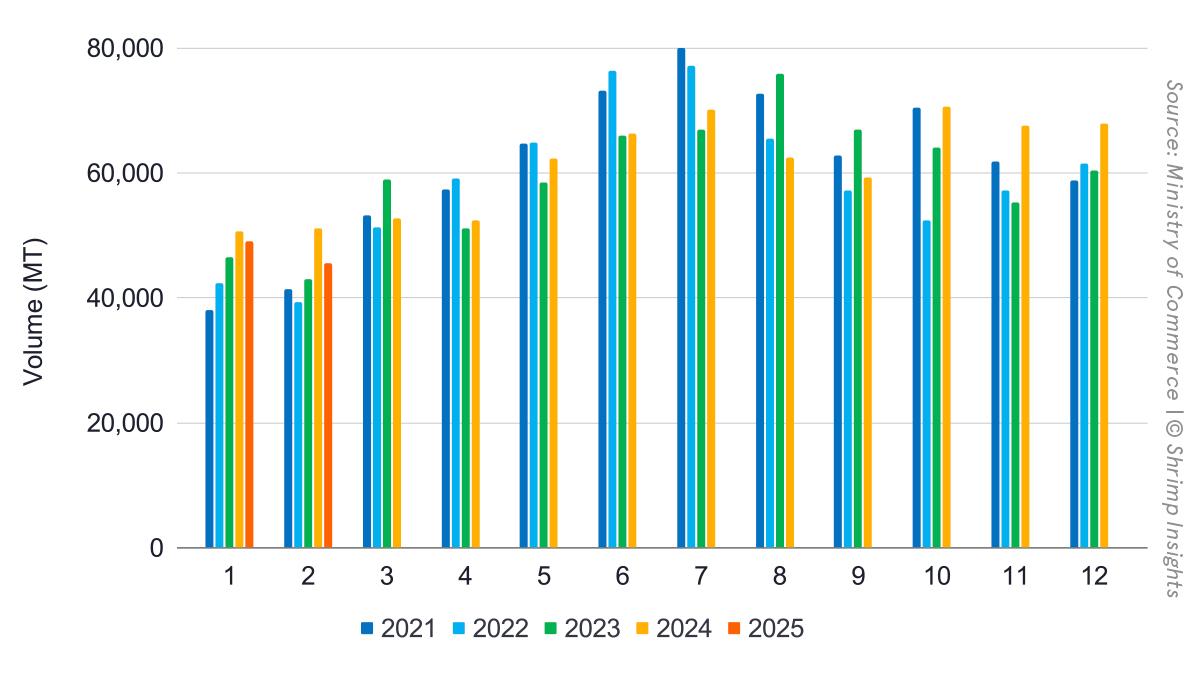
India’s shrimp exports under HS 030617 and HS 160521/29 dropped year over year for the second consecutive month. After a 3% drop in January, exports fell 11% in February. While in January, the value of those exports still increased year over year by 3%, in February, the value dropped by 7%. The year-total export volume has now reached 94,545 MT and is 7% behind year over year. The year's total export value reached $693 million and is 4% ahead year over year.
In terms of products, the drop in exports in January and February is accounted for by raw frozen wild (-3%), farmed L. vannamei (%), and P. monodon (%). Exports of value-added products increased significantly by 34%. Value-added products are primarily exported to the US and compensate for a drop in exports of raw L. vannamei to the US. With exports to the US still slightly up in January but slightly down in February, it is expected that the year-over-year increases of US imports from India in Q1, as reported by NOAA, will decline in April and May.
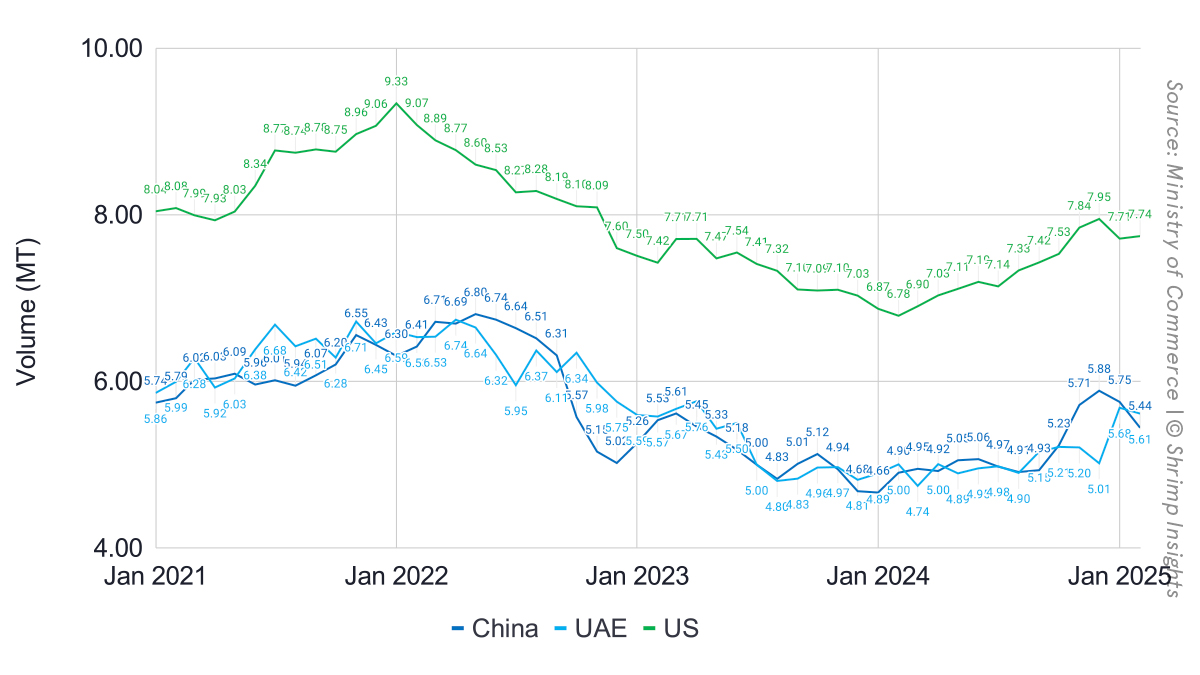
Regarding other markets, the EU is the only market that has seen an increase in exports from India in the first two months of 2025 (+24%). The other top five markets, China (-43%), Vietnam (-27%), and Japan (-12%), are all down year over year.
Total Shrimp Exports under HS 030617 and HS 160521/29
- Volume
- January: 49,058.1 MT = -3% YoY
- February: 45,486.8 MT = -11% YoY
- YTD (January-February): 94,544.9 MT = -7% YoY
- Value
- January: $354.74 mln = +9% YoY
- February: $328.02 mln = -1% YoY
- YTD (January-February): $682.76 mln = +4% YoY
Products
- Raw L. vannamei (HS 03061720)
- January: 35,766 MT = -8% YoY
- February: 33,262 MT = -15% YoY
- YTD (January-February): 69,028 MT = -11% YoY
- Raw P. monodon (HS 03061740)
- January: 2,425 MT = -0% YoY
- February: 1,230 MT = -47% YoY
- YTD (January-February): 3,655 MT = -23% YoY
- Value-added products (HS 160521, HS 160529)
- January: 5,631 MT = +38% YoY
- February: 6,055 MT = +31% YoY
- YTD (January-February): 11,686 MT = +34% YoY
- Raw wild-caught (HS 03061711/19/30/50/90)
- January: 5,236 MT = -0% YoY
- February: 4,939 MT = -5% YoY
- YTD (January-February): 10,175 MT = -3% YoY
Top 5 Markets
- US
- January: 21,724 MT = +6% YoY
- February: 21,813 MT = -3% YoY
- YTD (January-February): 43,537 MT = +1% YoY
- China
- January: 5,247 MT = -45% YoY
- February: 5,112 MT = -40% YoY
- YTD (January-February): 10,359 MT = -43% YoY
- EU
- January: 7,303 MT = +21% YoY
- February: 7,537 MT = +27% YoY
- YTD (January-February): 14,840 MT = +24% YoY
- Vietnam
- January: 3,568 MT = +30% YoY
- February: 0 MT = -100% YoY
- YTD (January-February): 3,568 MT = -27% YoY
- Japan
- January: 2,299 MT = -14% YoY
- February: 2,005 MT = -9% YoY
- YTD (January-February): 4,304 MT = -12% YoY