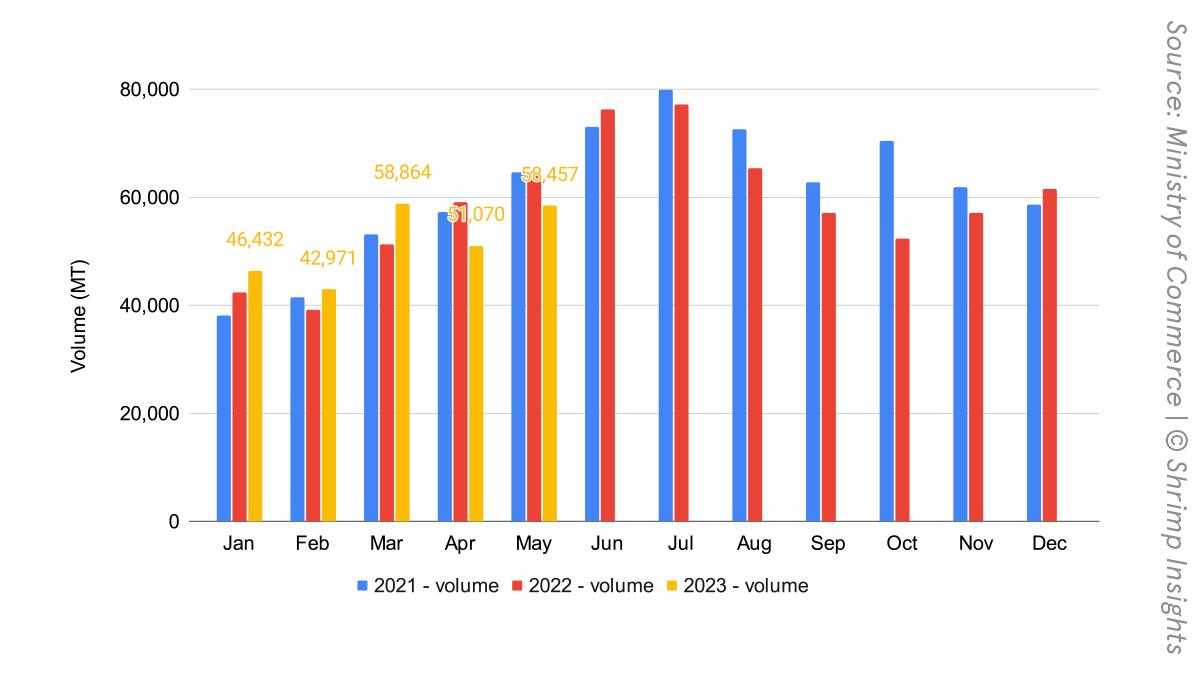
India’s shrimp export volume from January-May 2023 did not drop as far as expected. On the contrary, with 148,267 MT, the first quarter of 2023 recorded a 12% higher export volume than in 2022. With -14% in April, the export volume dipped for the first time below the same month in 2022. Based on broodstock import numbers and talk from India about the reduced stocking for 2023’s first crop, I expected exports in May to drop deeper. However, with -8%, the drop was less severe than I anticipated. This suggests that the first crop was larger than expected or that in May Indian exporters had still been selling stock from last year. Overall, between January and May, with 257,793 MT, this year's total export volume is now at the same level as in 2022. The export value is a different story. The year total export value from January-May is $1.8 billion, down 13% year-on-year. The export value dipped most in April and May, when the export value was down by 23% and 22% year-on-year, respectively.
The export trend varies from product to product (see table below). Exports of raw L. vannamei - by far India’s largest export product - dropped much less steeply. Exports only decreased year-on-year since April, and the year total from January till May is still up by 4%. In terms of export markets, with a drop of 8% of the export volume to that market, the US saw its share of India’s exports fall to 44%. Exports to China increased a couple of hundred MT, but China’s share of India’s exports of this product dropped by 1%. Exports to the EU and other Asian markets grew by 11% and 17%. In Europe, growth occurs in most countries. In Asia, the growth was largely accounted for by Vietnam.
| Jan | Feb | Mar | Apr | May | Jan-May | Jan-May (MT) | |
|---|---|---|---|---|---|---|---|
| Raw L. vannamei | 16% | 21% | 23% | -12% | -10% | 4% | 201,242 |
| Raw P. monodon | 89% | 106% | 336% | 178% | 124% | 157% | 10,586 |
| Value-added | -15% | -27% | -27% | -27% | -23% | -26% | 21,702 |
| Wild shrimp | -15% | -21% | -14% | -36% | -16% | -20% | 24,262 |
| Total | 10% | 9% | 15% | -14% | -10% | 0% | 257,793 |
Value-added (mainly cooked) products accounted for the biggest drop in India’s exports. Exports dropped below 2022 every month. Between January-May, the year-total export volume decreased by 26%—a signal of declining demand from US retail. After a 33% drop in exports to the US, its share of India’s exports fell from 84% to 77%. A 33% increase in exports to the EU partly compensated for the drop in exports to the US, and the EU increased its share of India’s value-added exports to 8%.
Exports of P.monodon have steeply increased in the first five months of 2023 and reached 10,586 MT compared to only 4,000 MT over the same period in 2022, an increase of 157%. According to sources in India, the volume of P. monodon will continue to grow significantly over the next couple of months, with peak harvests expected between August and early October. Broodstock import and production numbers of Vaishnavi Aquatech and Unima support this claim. Interestingly, sources mention that while last year India’s exporters sold P. monodon at similar prices as its Bangladeshi competitors, this year, it seems that Indian exporters have managed to maintain a higher price level.
Regarding the markets for P. monodon, last year, the EU absorbed the largest part of India’s growth and had a 30% share of exports. This year EU imports dropped by 34% year-on-year, and the EU’s share dropped to 20%. Exports to China grew by 200%, and China’s share is now 17%. The biggest market remains in the rest of Asia, which increased its share from 39% in 2022 to 46% in 2023. In absolute terms, exports to the rest of Asia almost tripled to 4,826 MT, mainly accounted for by Japan and Vietnam. The US’s market share of India’s P. monodon exports dropped from 20% in 2022 to 14% in 2023, a drop of 31% in absolute terms.
Read more trade data analysis in my next blog, where I will reflect on the four largest shrimp producers and the three largest markets.