After a slow start to the year in January and February, March exports made up for the earlier year-over-year decline. By the end of Q1 2025, India had exported 154,658 MT of shrimp, valued at $1.1 billion. This marks no change in volume compared to Q1 2024 but reflects a 12% increase in export value.
Exports of raw frozen L. vannamei, P. monodon, and wild-caught shrimp declined year-over-year. However, a rise in shipments of value-added products offset these losses.
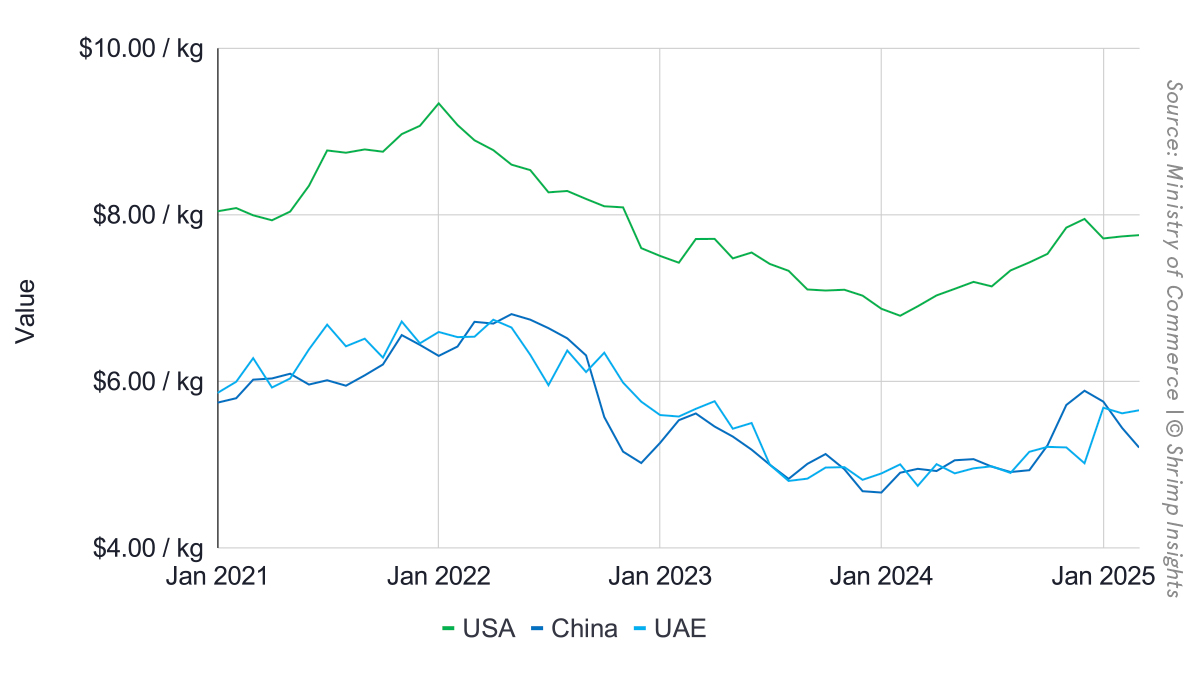
Looking at key markets, the US (+11%), EU (+21%), and Japan (+6%) increased their imports of Indian shrimp, while exports to China (-23%) and Canada (-1%) declined. Average export values to most destinations remained stable, but the average value of shipments to China dropped further, highlighting continued weak demand in that market.
Total Shrimp Exports under HS 030617 and HS 160521/29
- Volume
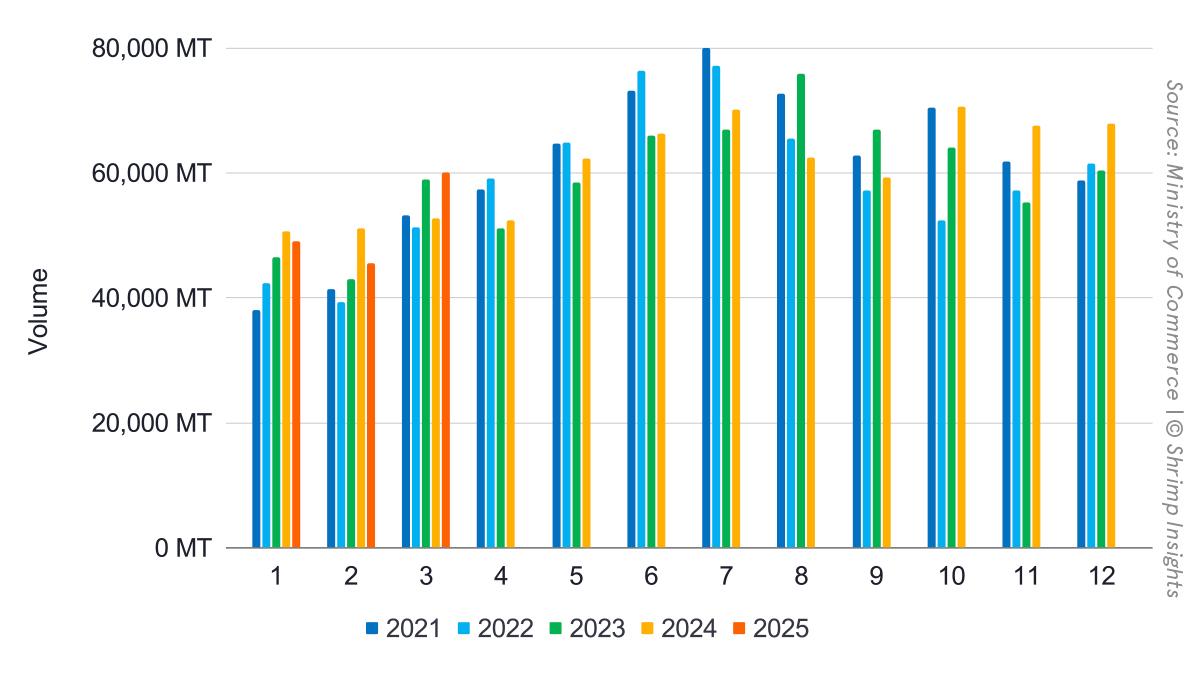
- January: 49,058 MT = -3% YoY
- February: 45,487 MT = -11% YoY
- March: 60,113 MT = +14% YoY
- Q1: 154,658 MT = +0% YoY
- Value
- January: $355 million = +9% YoY
- February: $328 million = -1% YoY
- March: $427 million = +26% YoY
- Q1: $1,110 million = +12% YoY
Products
- Raw L. vannamei (HS 03061720)
- January: 35,766 MT = -8% YoY
- February: 33,262 MT = -15% YoY
- March: 46,580 MT = +14% YoY
- Q1: 115,608 MT = -3% YoY
- Raw P. monodon (HS 03061740)
- January: 2,425 MT = -0% YoY
- February: 1,230 MT = -47% YoY
- March: 1,444 MT = -28% YoY
- Q1: 5,099 MT = -24% YoY
- Value-added products (HS 160521, HS 160529)
- January: 5,631 MT = +38% YoY
- February: 6,055 MT = +31% YoY
- March: 6,563 MT = +41% YoY
- Q1: 18,250 MT = +36% YoY
- Raw wild-caught (HS 03061711/19/30/50/90)
- January: 5,236 MT = -0% YoY
- February: 4,939 MT = -5% YoY
- March: 5,525 MT = +8% YoY
- Q1: 15,700 MT = +1% YoY
Top 5 Markets
- US
- January: 21,724 MT = +6% YoY
- February: 21,813 MT = -3% YoY
- March: 26,794 MT = +32% YoY
- Q1: 70,331 MT = +11% YoY
- EU
- January: 7,303 MT = +21% YoY
- February: 7,537 MT = +27% YoY
- March: 8,297 MT = +17% YoY
- Q1: 23,137 MT = +21% YoY
- China
- January: 5,247 MT = -45% YoY
- February: 5,112 MT = -40% YoY
- March: 10,908 MT = +13% YoY
- Q1: 21,267 MT = -23% YoY
- Japan
- January: 2,299 MT = -14% YoY
- February: 2,005 MT = -9% YoY
- March: 3,210 MT = +46% YoY
- Q1: 7,514 MT = +6% YoY
- Canada
- January: 1,399 MT = -17% YoY
- February: 1,566 MT = -15% YoY
- March: 2,303 MT = +29% YoY
- Q1: 5,267 MT = -1% YoY