Export Volumes Dip, Export Value Holds Up
In July, India exported 68,527 MT of shrimp, down 2% compared to last year. Year-to-date (Jan–Jul), exports reached 414,729 MT, a 2% increase over the same period in 2024. Export value in July was $491 million, 7% higher year-on-year. Cumulatively, exports were worth $2.94 billion, up 12% year-on-year.
Vannamei Stable, Monodon Surges, Value-Added Keeps Momentum
Raw L. vannamei exports in July amounted to 54,970 MT, 5% lower year-on-year, bringing the Jan–Jul total to 328,160 MT, flat compared to 2024. Raw P. monodon exports, after six months of decline, surged in July with 2,807 MT, up 88% year-on-year, though the Jan–Jul total of 11,158 MT was still down 15%. Value-added shrimp continued its strong trajectory, with July exports of 7,012 MT, up 17%, and cumulative volumes of 44,288 MT, a 34% increase. Raw wild-caught shrimp dropped 22% in July to 3,737 MT, keeping year-to-date volumes flat at 31,122 MT.
US Pre-Tariff Imports Slow, EU Compensates and Continues to Grow
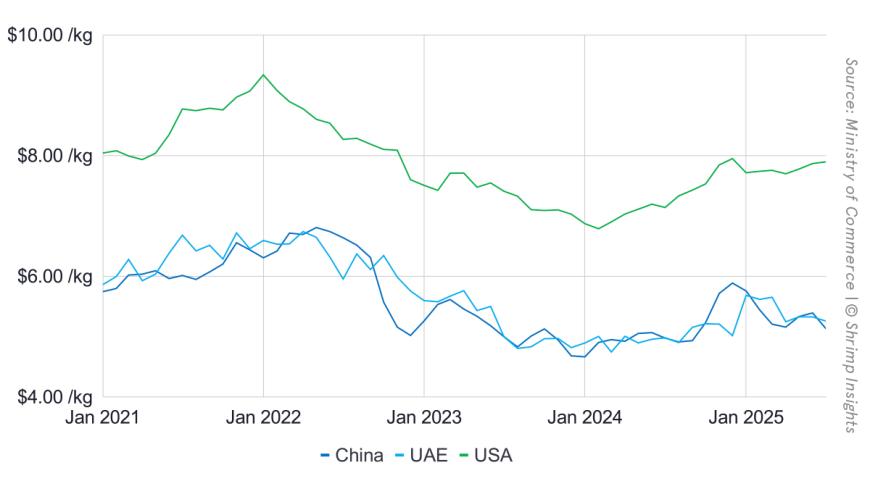
The US remained India’s top destination in July, importing 27,517 MT, down 10% from last year. Still, Jan–Jul exports to the US totaled 179,935 MT, up 9%. Exports to China grew 5% in July to 12,092 MT but remained 6% lower year-to-date at 77,169 MT. The EU stood out as the strongest growth market: July shipments were 10,780 MT, up 32% year-on-year, with Jan–Jul volumes of 58,287 MT, a 27% increase. Japan remained stable in July at 4,512 MT, flat year-on-year, but grew 4% year-to-date to 20,934 MT. Canada saw modest growth in July with 2,128 MT, up 3%, bringing the year-to-date total to 13,061 MT, 9% higher than last year.
Byte in Numbers
Total Shrimp Exports (HS 030617, HS 160521, HS 160529)
- Volume
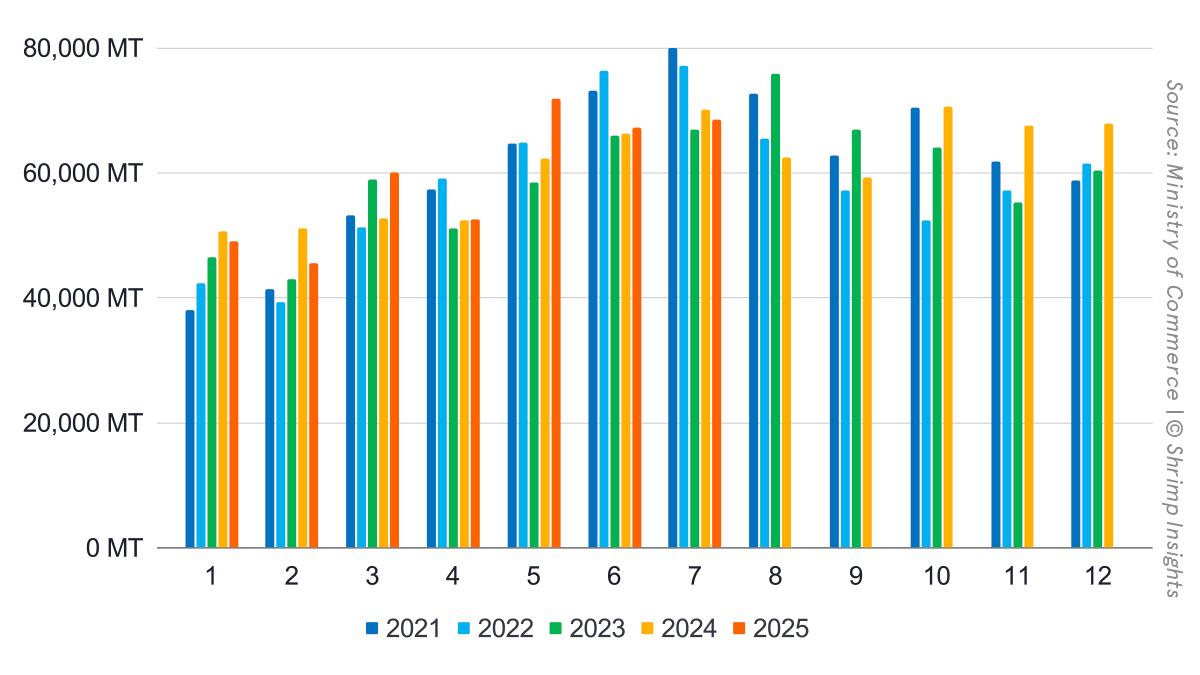
- Jan: 49,058 MT = -3% YoY
- Feb: 45,487 MT = -11% YoY
- Mar: 60,113 MT = +14% YoY
- Apr: 52,475 MT = +0% YoY
- May: 71,885 MT = +15% YoY
- Jun: 67,184 MT = +1% YoY
- Jul: 68,527 MT = -2% YoY
- YTD (Jan–Jul): 414,729 MT = +2% YoY
- Value
- Jan: $355 million = +9% YoY
- Feb: $328 million = -1% YoY
- Mar: $427 million = +26% YoY
- Apr: $367 million = +9% YoY
- May: $503 million = +24% YoY
- Jun: $469 million = +10% YoY
- Jul: $491 million = +7% YoY
- YTD (Jan–Jul): $2,940 million = +12% YoY
Products
- Raw L. vannamei (HS 03061720)
- Jan: 35,766 MT = -8% YoY
- Feb: 33,262 MT = -15% YoY
- Mar: 46,580 MT = +14% YoY
- Apr: 42,183 MT = -2% YoY
- May: 59,241 MT = +14% YoY
- Jun: 56,157 MT = -0% YoY
- Jul: 54,970 MT = -5% YoY
- YTD (Jan–Jul): 328,160 MT = +0% YoY
- Raw P. monodon (HS 03061740)
- Jan: 2,425 MT = -0% YoY
- Feb: 1,230 MT = -47% YoY
- Mar: 1,444 MT = -28% YoY
- Apr: 1,153 MT = -31% YoY
- May: 1,199 MT = -34% YoY
- Jun: 900 MT = -36% YoY
- Jul: 2,807 MT = +88% YoY
- YTD (Jan–Jul): 11,158 MT = -15% YoY
- Value-Added (HS 160521, HS 160529)
- Jan: 5,631 MT = +38% YoY
- Feb: 6,055 MT = +31% YoY
- Mar: 6,563 MT = +41% YoY
- Apr: 4,921 MT = +27% YoY
- May: 7,341 MT = +54% YoY
- Jun: 6,764 MT = +33% YoY
- Jul: 7,012 MT = +17% YoY
- YTD (Jan–Jul): 44,288 MT = +34% YoY
- Raw Wild-Caught (HS 03061711/19/30/50/90)
- Jan: 5,236 MT = -0% YoY
- Feb: 4,939 MT = -5% YoY
- Mar: 5,525 MT = +8% YoY
- Apr: 4,218 MT = +15% YoY
- May: 4,103 MT = +12% YoY
- Jun: 3,362 MT = -3% YoY
- Jul: 3,737 MT = -22% YoY
- YTD (Jan–Jul): 31,122 MT = -0% YoY
Top 5 Markets
- USA
- Jan: 21,724 MT = +6% YoY
- Feb: 21,813 MT = -3% YoY
- Mar: 26,794 MT = +32% YoY
- Apr: 22,651 MT = +14% YoY
- May: 32,810 MT = +28% YoY
- Jun: 26,627 MT = +5% YoY
- Jul: 27,517 MT = -10% YoY
- YTD (Jan–Jul): 179,935 MT = +9% YoY
- China
- Jan: 5,247 MT = -45% YoY
- Feb: 5,112 MT = -40% YoY
- Mar: 10,908 MT = +13% YoY
- Apr: 10,286 MT = -12% YoY
- May: 17,337 MT = +20% YoY
- Jun: 16,187 MT = -5% YoY
- Jul: 12,092 MT = +5% YoY
- YTD (Jan–Jul): 77,169 MT = -6% YoY
- EU
- Jan: 7,303 MT = +21% YoY
- Feb: 7,537 MT = +27% YoY
- Mar: 8,297 MT = +17% YoY
- Apr: 7,822 MT = +36% YoY
- May: 8,060 MT = +24% YoY
- Jun: 8,488 MT = +33% YoY
- Jul: 10,780 MT = +32% YoY
- YTD (Jan–Jul): 58,287 MT = +27% YoY
- Japan
- Jan: 2,299 MT = -14% YoY
- Feb: 2,005 MT = -9% YoY
- Mar: 3,210 MT = +46% YoY
- Apr: 2,435 MT = +35% YoY
- May: 3,152 MT = +8% YoY
- Jun: 3,322 MT = -11% YoY
- Jul: 4,512 MT = +0% YoY
- YTD (Jan–Jul): 20,934 MT = +4% YoY
- Canada
- Jan: 1,399 MT = -17% YoY
- Feb: 1,566 MT = -15% YoY
- Mar: 2,303 MT = +29% YoY
- Apr: 2,059 MT = +27% YoY
- May: 1,809 MT = +20% YoY
- Jun: 1,798 MT = +19% YoY
- Jul: 2,128 MT = +3% YoY
- YTD (Jan–Jul): 13,061 MT = +9% YoY