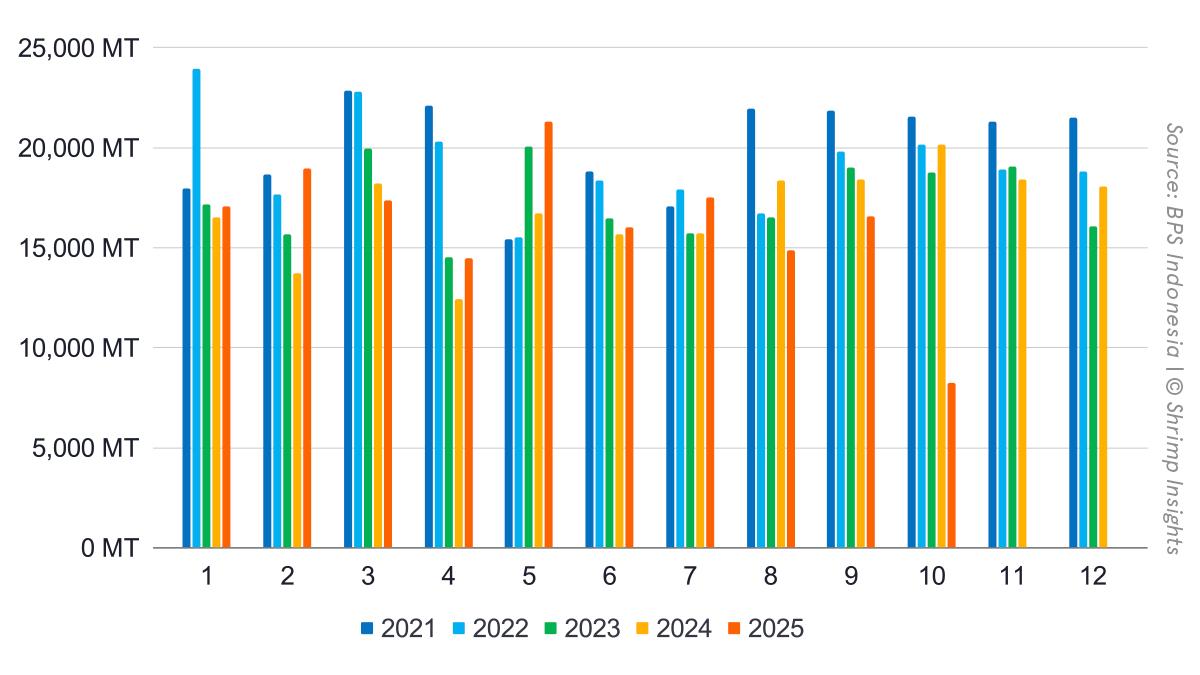
Indonesia’s shrimp exports collapsed in October, with volumes plunging to 8,233 MT, down 59% year-on-year, marking by far the weakest month of 2025. Export value mirrored this drop, falling to USD 76 million (-55% YoY). As a result, year-to-date volumes slipped back into negative territory at 162,434 MT (-2% YoY), while value remained firmly positive at USD 1.41 billion (+8% YoY)—underscoring how sharply October deviated from an otherwise resilient year.
Products
The October correction was broad-based across all product categories. Raw L. vannamei, Indonesia’s core export item, fell to 3,868 MT (-60% YoY), halving volumes compared to the summer months. Cooked and marinated shrimp, which had been one of the strongest performers earlier in the year, dropped even more sharply to 1,696 MT (-67% YoY). Breaded shrimp declined to 441 MT (-57% YoY), continuing the weakness already visible since August. P. monodon proved relatively more stable but still declined to 872 MT (-11% YoY). Despite the October shock, YTD figures still show growth for value-added categories, particularly cooked and marinated shrimp at +11% YoY.
Markets
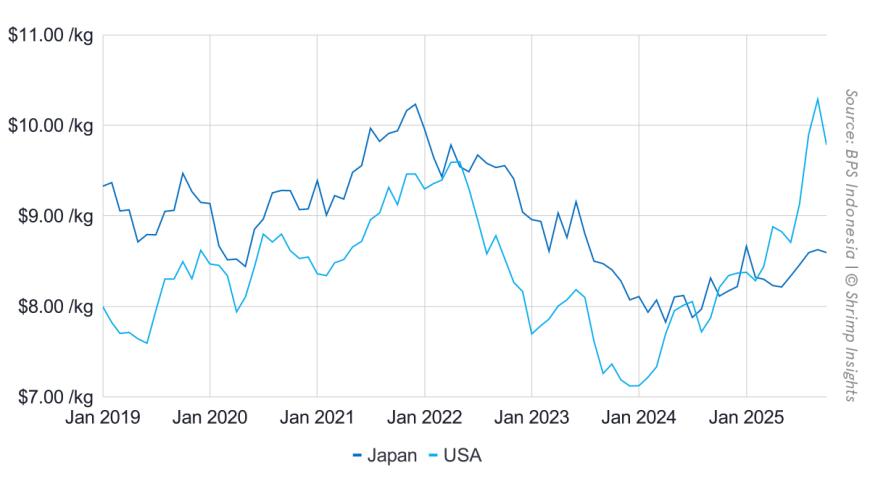
The collapse in October exports was overwhelmingly driven by the United States. Shipments to the US fell to just 1,860 MT, an 86% year-on-year decline, compared with monthly volumes of around 10–14 thousand MT earlier in the year. This single market shock explains most of Indonesia’s overall October contraction.
In contrast, Japan moved counter-cyclically, with October volumes rising to 3,467 MT (+20% YoY), making it Indonesia’s largest market that month. EU-27 imports continued to expand year-to-date (+47% YoY), although October growth moderated to +7% YoY. China and Canada both declined in October but remain positive on a YTD basis.
Cesium-137: the key disruption behind October
The dramatic fall in US-bound shipments is closely linked to the ongoing cesium-137 contamination concerns that surfaced in mid-2025. Heightened scrutiny and testing requirements by US authorities led to shipment delays, holds, and, in some cases, rejected or postponed consignments. In early December, the Indonesian government announced that it had released more than 600 containers that had undergone the Cesium-137 testing protocol and had been declared free. This may be the start of the normalization of Indonesia-US shrimp exports. While we expect November exports to show an equally sharp decline, December exports may decline slightly less sharply, and in the first half of 2026, exports may gradually return to previous levels.
Byte in Numbers
Totals
- Volume
- Jan: 17,094 MT = +4% YoY
- Feb: 18,988 MT = +38% YoY
- Mar: 17,365 MT = -5% YoY
- Apr: 14,489 MT = +16% YoY
- May: 21,288 MT = +27% YoY
- Jun: 16,036 MT = +2% YoY
- Jul: 17,525 MT = +12% YoY
- Aug: 14,862 MT = -19% YoY
- Sep: 16,554 MT = -10% YoY
- Oct: 8,233 MT = -59% YoY
- YTD (Jan–Oct): 162,434 MT = -2% YoY
- Value
- Jan: $141 million = +14% YoY
- Feb: $157 million = +48% YoY
- Mar: $150 million = +9% YoY
- Apr: $128 million = +31% YoY
- May: $180 million = +33% YoY
- Jun: $133 million = +10% YoY
- Jul: $150 million = +19% YoY
- Aug: $138 million = -3% YoY
- Sep: $154 million = +5% YoY
- Oct: $76 million = -55% YoY
- YTD (Jan–Oct): $1,407 million = +8% YoY
Products
- Raw L. Vannamei
- Jan: 8,792 MT = +14% YoY
- Feb: 8,868 MT = +34% YoY
- Mar: 8,388 MT = +7% YoY
- Apr: 7,007 MT = +23% YoY
- May: 9,828 MT = +23% YoY
- Jun: 7,979 MT = +24% YoY
- Jul: 8,156 MT = +17% YoY
- Aug: 7,189 MT = -20% YoY
- Sep: 7,705 MT = -16% YoY
- Oct: 3,868 MT = -60% YoY
- YTD (Jan–Oct): 77,779 MT = +1% YoY
- Raw P. Monodon
- Jan: 350 MT = -59% YoY
- Feb: 816 MT = +16% YoY
- Mar: 765 MT = -15% YoY
- Apr: 701 MT = +4% YoY
- May: 853 MT = -8% YoY
- Jun: 549 MT = -39% YoY
- Jul: 714 MT = -27% YoY
- Aug: 752 MT = -8% YoY
- Sep: 762 MT = -18% YoY
- Oct: 872 MT = -11% YoY
- YTD (Jan–Oct): 7,134 MT = -18% YoY
- Cooked and Marinated
- Jan: 4,934 MT = +26% YoY
- Feb: 5,549 MT = +45% YoY
- Mar: 5,458 MT = +20% YoY
- Apr: 4,355 MT = +36% YoY
- May: 5,951 MT = +61% YoY
- Jun: 4,032 MT = +15% YoY
- Jul: 5,093 MT = +26% YoY
- Aug: 4,738 MT = -7% YoY
- Sep: 4,716 MT = -2% YoY
- Oct: 1,696 MT = -67% YoY
- YTD (Jan–Oct): 46,523 MT = +11% YoY
- Breaded
- Jan: 745 MT = +11% YoY
- Feb: 745 MT = +21% YoY
- Mar: 698 MT = -11% YoY
- Apr: 602 MT = +5% YoY
- May: 934 MT = +15% YoY
- Jun: 997 MT = +15% YoY
- Jul: 994 MT = -1% YoY
- Aug: 578 MT = -53% YoY
- Sep: 477 MT = -43% YoY
- Oct: 441 MT = -57% YoY
- YTD (Jan–Oct): 7,212 MT = -14% YoY
Top Five Markets
- USA
- Jan: 11,531 MT = +10% YoY
- Feb: 12,271 MT = +29% YoY
- Mar: 11,695 MT = -4% YoY
- Apr: 9,790 MT = +15% YoY
- May: 14,458 MT = +25% YoY
- Jun: 9,908 MT = +0% YoY
- Jul: 10,762 MT = +2% YoY
- Aug: 8,813 MT = -30% YoY
- Sep: 9,913 MT = -21% YoY
- Oct: 1,860 MT = -86% YoY
- YTD (Jan–Oct): 101,000 MT = -9% YoY
- Japan
- Jan: 2,452 MT = -4% YoY
- Feb: 2,779 MT = +23% YoY
- Mar: 2,859 MT = +16% YoY
- Apr: 2,468 MT = +11% YoY
- May: 2,802 MT = -6% YoY
- Jun: 2,622 MT = -5% YoY
- Jul: 2,834 MT = +4% YoY
- Aug: 2,685 MT = -10% YoY
- Sep: 2,669 MT = +5% YoY
- Oct: 3,467 MT = +20% YoY
- YTD (Jan–Oct): 27,637 MT = +5% YoY
- China
- Jan: 1,079 MT = -32% YoY
- Feb: 1,381 MT = +631% YoY
- Mar: 205 MT = -85% YoY
- Apr: 181 MT = +36% YoY
- May: 1,620 MT = +294% YoY
- Jun: 1,398 MT = +12% YoY
- Jul: 1,421 MT = +247% YoY
- Aug: 313 MT = -19% YoY
- Sep: 1,379 MT = +8% YoY
- Oct: 798 MT = -53% YoY
- YTD (Jan–Oct): 9,774 MT = +12% YoY
- EU-27
- Jan: 713 MT = +72% YoY
- Feb: 884 MT = +51% YoY
- Mar: 1,027 MT = +75% YoY
- Apr: 590 MT = +25% YoY
- May: 896 MT = +97% YoY
- Jun: 795 MT = +35% YoY
- Jul: 959 MT = +30% YoY
- Aug: 1,256 MT = +66% YoY
- Sep: 980 MT = +33% YoY
- Oct: 609 MT = +7% YoY
- YTD (Jan–Oct): 8,708 MT = +47% YoY
- Canada
- Jan: 324 MT = +185% YoY
- Feb: 491 MT = +261% YoY
- Mar: 420 MT = +38% YoY
- Apr: 399 MT = +204% YoY
- May: 340 MT = +28% YoY
- Jun: 273 MT = +33% YoY
- Jul: 317 MT = +18% YoY
- Aug: 383 MT = +91% YoY
- Sep: 351 MT = +19% YoY
- Oct: 203 MT = -41% YoY
- YTD (Jan–Oct): 3,502 MT = +55% YoY