Total Exports
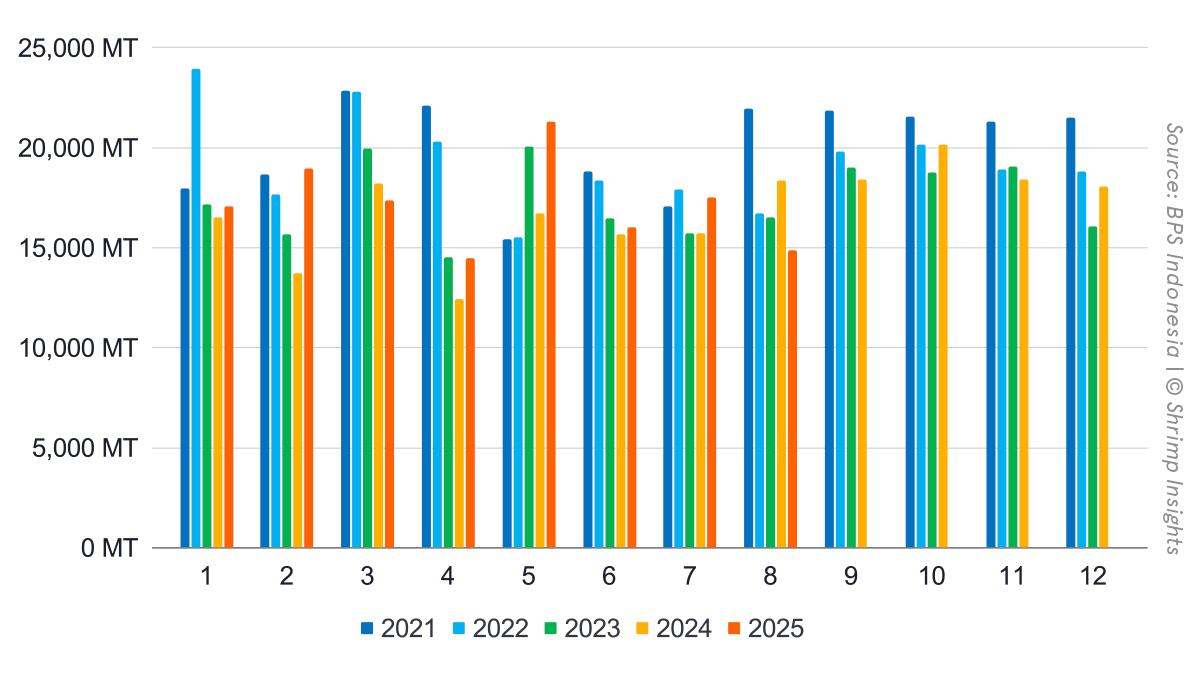
Indonesia’s shrimp exports showed solid growth through most of 2025 but softened sharply in August — the first month reflecting the impact of new US tariffs. Total exports in August dropped to 14,862 MT, down 19% YoY, bringing the year-to-date (Jan–Aug) total to 137,647 MT, still 8% higher YoY. Export value held up better, reaching $138 million in August (-3% YoY) and $1.18 billion YTD (+19% YoY), indicating stronger prices and a more favorable product mix earlier in the year.
Until July, exports had grown consistently, supported by robust demand from the US, Japan, and Europe. August’s contraction marks a turning point, with exporters starting to redirect volumes away from the US towards other key markets.
Products
Across product categories, raw L. vannamei remained the dominant export, totaling 66,206 MT YTD (+14% YoY). Shipments fell to 7,189 MT in August, down 20% YoY, showing clear sensitivity to the US slowdown.
Cooked and marinated products continued to perform strongly, reflecting Indonesia’s growing value-added capabilities. At 4,738 MT in August (-7% YoY) and 40,111 MT YTD (+26% YoY), this segment remained resilient and crucial for diversification.
Exports of raw P. monodon stayed modest at 5,500 MT YTD (-18% YoY), while breaded products showed the sharpest August decline (-53% YoY) to 578 MT, bringing the YTD total to 6,294 MT (-4% YoY).
Overall, Indonesia’s value-added segments helped cushion the impact of falling raw product exports to the US, underscoring the country’s gradual shift toward higher-margin products.
Markets
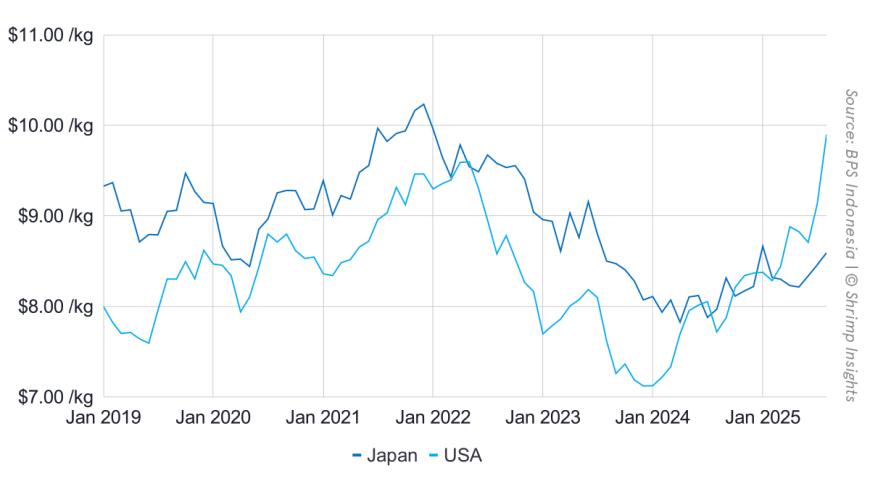
The US remained Indonesia’s most significant market but clearly reflected tariff effects. Exports fell from 10,762 MT in July to 8,813 MT in August (-30% YoY). Despite this drop, YTD exports reached 89,228 MT (+4% YoY), showing how strong earlier-year performance had been.
Meanwhile, other markets accelerated. Exports to the EU-27 continued their remarkable climb, up 66% YoY in August and 55% YTD, confirming Europe’s growing role as a key alternative destination. Canada also stood out with an 81% YTD increase and a 91% YoY surge in August — a clear signal of successful market diversification.
Japan remained steady with +3% YTD, while China’s erratic but improving trend delivered +32% YTD, despite a weaker August.
Conclusion
August marked the first clear sign of disruption from US tariffs, with Indonesia’s shipments to its primary market down sharply. However, the strong performance in the EU and Canada highlights the industry’s adaptability and diversification strategy. September exports will most likely drop further due to tariffs, and on top of that, the impact of the contaminated shrimp case relating to one of Indonesia’s largest exporters.
Byte in Numbers
Totals
- Volume
- Jan: 17,094 MT = +4% YoY
- Feb: 18,988 MT = +38% YoY
- Mar: 17,365 MT = -5% YoY
- Apr: 14,489 MT = +16% YoY
- May: 21,288 MT = +27% YoY
- Jun: 16,036 MT = +2% YoY
- Jul: 17,525 MT = +12% YoY
- Aug: 14,862 MT = -19% YoY
- YTD (Jan–Aug): 137,647 MT = +8% YoY
- Value
- Jan: $141 million = +14% YoY
- Feb: $157 million = +48% YoY
- Mar: $150 million = +9% YoY
- Apr: $128 million = +31% YoY
- May: $180 million = +33% YoY
- Jun: $133 million = +10% YoY
- Jul: $150 million = +19% YoY
- Aug: $138 million = -3% YoY
- YTD (Jan–Aug): $1,176 million = +19% YoY
Products
- Raw L. Vannamei
- Jan: 8,792 MT = +14% YoY
- Feb: 8,868 MT = +34% YoY
- Mar: 8,388 MT = +7% YoY
- Apr: 7,007 MT = +23% YoY
- May: 9,828 MT = +23% YoY
- Jun: 7,979 MT = +24% YoY
- Jul: 8,156 MT = +17% YoY
- Aug: 7,189 MT = -20% YoY
- YTD (Jan–Aug): 66,206 MT = +14% YoY
- Raw P. Monodon
- Jan: 350 MT = -59% YoY
- Feb: 816 MT = +16% YoY
- Mar: 765 MT = -15% YoY
- Apr: 701 MT = +4% YoY
- May: 853 MT = -8% YoY
- Jun: 549 MT = -39% YoY
- Jul: 714 MT = -27% YoY
- Aug: 752 MT = -8% YoY
- YTD (Jan–Aug): 5,500 MT = -18% YoY
- Cooked and Marinated
- Jan: 4,934 MT = +26% YoY
- Feb: 5,549 MT = +45% YoY
- Mar: 5,458 MT = +20% YoY
- Apr: 4,355 MT = +36% YoY
- May: 5,951 MT = +61% YoY
- Jun: 4,032 MT = +15% YoY
- Jul: 5,093 MT = +26% YoY
- Aug: 4,738 MT = -7% YoY
- YTD (Jan–Aug): 40,111 MT = +26% YoY
- Breaded
- Jan: 745 MT = +11% YoY
- Feb: 745 MT = +21% YoY
- Mar: 698 MT = -11% YoY
- Apr: 602 MT = +5% YoY
- May: 934 MT = +15% YoY
- Jun: 997 MT = +15% YoY
- Jul: 994 MT = -1% YoY
- Aug: 578 MT = -53% YoY
- YTD (Jan–Aug): 6,294 MT = -4% YoY
Top Five Markets
- USA
- Jan: 11,531 MT = +10% YoY
- Feb: 12,271 MT = +29% YoY
- Mar: 11,695 MT = -4% YoY
- Apr: 9,790 MT = +15% YoY
- May: 14,458 MT = +25% YoY
- Jun: 9,908 MT = +0% YoY
- Jul: 10,762 MT = +2% YoY
- Aug: 8,813 MT = -30% YoY
- YTD (Jan–Aug): 89,228 MT = +4% YoY
- Japan
- Jan: 2,452 MT = -4% YoY
- Feb: 2,779 MT = +23% YoY
- Mar: 2,859 MT = +16% YoY
- Apr: 2,468 MT = +11% YoY
- May: 2,802 MT = -6% YoY
- Jun: 2,622 MT = -5% YoY
- Jul: 2,834 MT = +4% YoY
- Aug: 2,685 MT = -10% YoY
- YTD (Jan–Aug): 21,500 MT = +3% YoY
- China
- Jan: 1,079 MT = -32% YoY
- Feb: 1,381 MT = +631% YoY
- Mar: 205 MT = -85% YoY
- Apr: 181 MT = +36% YoY
- May: 1,620 MT = +294% YoY
- Jun: 1,398 MT = +12% YoY
- Jul: 1,421 MT = +247% YoY
- Aug: 313 MT = -19% YoY
- YTD (Jan–Aug): 7,598 MT = +32% YoY
- EU-27
- Jan: 713 MT = +72% YoY
- Feb: 884 MT = +51% YoY
- Mar: 1,027 MT = +75% YoY
- Apr: 590 MT = +25% YoY
- May: 896 MT = +97% YoY
- Jun: 795 MT = +35% YoY
- Jul: 959 MT = +30% YoY
- Aug: 1,256 MT = +66% YoY
- YTD (Jan–Aug): 7,119 MT = +55% YoY
- Canada
- Jan: 324 MT = +185% YoY
- Feb: 491 MT = +261% YoY
- Mar: 420 MT = +38% YoY
- Apr: 399 MT = +204% YoY
- May: 340 MT = +28% YoY
- Jun: 273 MT = +33% YoY
- Jul: 317 MT = +18% YoY
- Aug: 383 MT = +91% YoY
- YTD (Jan–Aug): 2,948 MT = +81% YoY