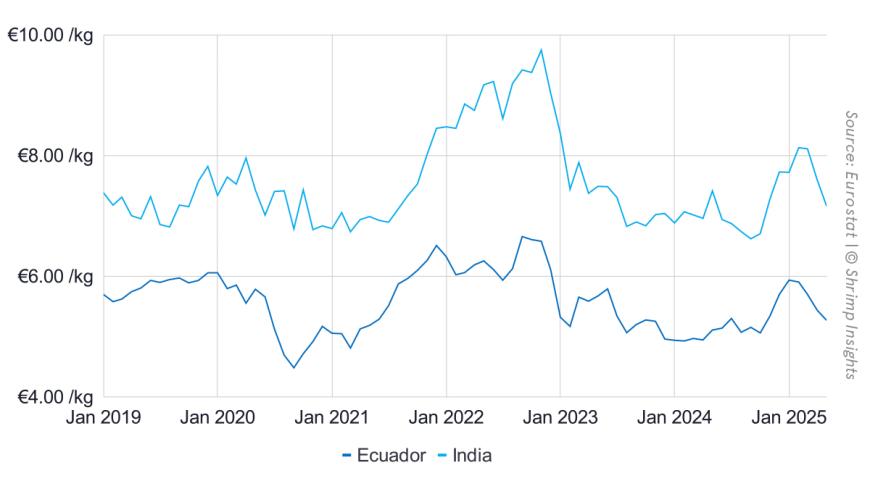
The European Union imported 40,547 metric tons of raw frozen and value-added warmwater shrimp in May 2025, marking a 27% increase year-over-year and the highest May volume ever recorded. The total value of imports rose 24% to €246 million. For the first five months of the year, imports totaled 164,701 metric tons worth €1.08 billion—up 19% and 28% respectively compared to the same period in 2024. The graph below shows that the year-on-year growth in volume and value, comes at the cost of a downward price trend since the beginning of this year. If this trend continues, prices may reach similar low levels as in the first half of 2024 soon.
Regional Breakdown: Southern and Northwestern EU Both Show Significant Growth, While Eastern EU Stays Behind
Southern EU markets—led by Spain, France and Italy—imported 25,843 metric tons in May, up 31% compared to last year and accounting for nearly two-thirds of the total volume. Northwestern Europe followed with 13,731 metric tons, marking a 27% increase and continuing its upward trend since March. In contrast, Eastern EU imports dropped 28% to just 973 metric tons, dragging down its YTD growth to -12%.
Top Suppliers: Ecuador Widens Its Lead, But India and Vietnam Grow Their Market As Well
Ecuador extended its dominance in the EU shrimp market, shipping 24,188 metric tons in May—a 39% increase year-over-year. This brought its YTD total to 88,625 metric tons, representing more than half of the EU’s shrimp imports so far this year. India followed with 4,817 metric tons in May (+25%), consolidating its second-place position with a YTD total of 21,363 metric tons. Vietnam made a strong showing in May, increasing exports by 53% to 4,791 metric tons, outpacing its January–May growth rate of 23%. Venezuela, once a key supplier, continued its steep decline. May volumes dropped 9% to 1,996 metric tons, and its year-to-date total fell to just 10,309 metric tons—down 41% from last year. Meanwhile, Bangladesh’s May exports declined by 10%, reflecting continued volatility in its EU-bound volumes despite positive YTD growth of 16%.
Byte in Numbers
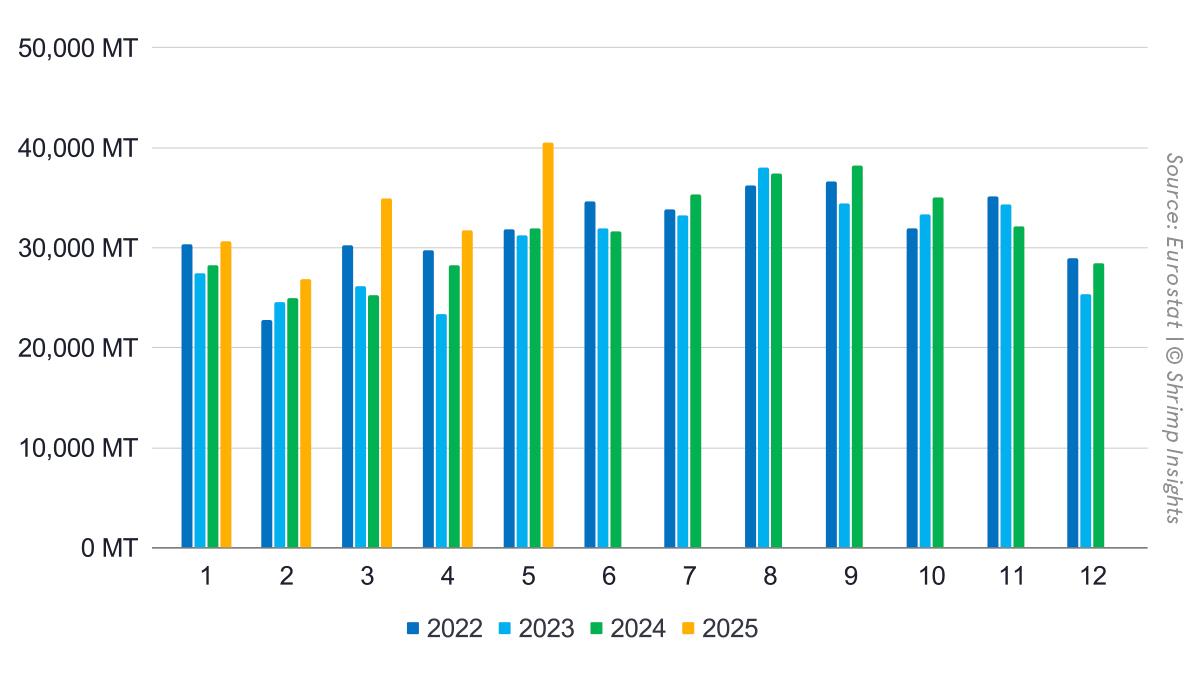
Total Raw Frozen Penaeus (HS 03061792) and Value-Added (HS 160521, 160529) from Asia, Latin America, and Africa
- Volume:
- Jan: 30,604 MT = +8% YoY
- Feb: 26,849 MT = +8% YoY
- Mar: 34,960 MT = +39% YoY
- Apr: 31,741 MT = +12% YoY
- May: 40,547 MT = +27% YoY
- YTD (Jan–May): 164,701 MT = +19% YoY
- Value:
- Jan: €212 million = +26% YoY
- Feb: €184 million = +21% YoY
- Mar: €232 million = +56% YoY
- Apr: €201 million = +19% YoY
- May: €246 million = +24% YoY
- YTD (Jan–May): €1,075 million = +28% YoY
Import Regions of Raw Frozen Penaeus and Value-Added from Asia, Latin America, and Africa
- Southern EU:
- Jan: 15,998 MT = -4% YoY
- Feb: 16,252 MT = +15% YoY
- Mar: 22,402 MT = +42% YoY
- Apr: 20,598 MT = +14% YoY
- May: 25,843 MT = +31% YoY
- YTD (Jan–May): 101,093 MT = +20% YoY
- Northwestern EU (Western Europe):
- Jan: 13,649 MT = +30% YoY
- Feb: 9,819 MT = -2% YoY
- Mar: 11,861 MT = +37% YoY
- Apr: 9,995 MT = +9% YoY
- May: 13,731 MT = +27% YoY
- YTD (Jan–May): 59,055 MT = +20% YoY
- Eastern EU:
- Jan: 957 MT = -14% YoY
- Feb: 779 MT = -10% YoY
- Mar: 697 MT = -16% YoY
- Apr: 1,148 MT = +15% YoY
- May: 973 MT = -28% YoY
- YTD (Jan–May): 4,554 MT = -12% YoY
Products
- Raw Frozen Penaeus Shrimp (HS 03061792):
- Jan: 25,929 MT = +2% YoY
- Feb: 23,090 MT = +7% YoY
- Mar: 30,990 MT = +40% YoY
- Apr: 27,518 MT = +11% YoY
- May: 35,613 MT = +29% YoY
- YTD (Jan–May): 143,140 MT = +18% YoY
- Value-Added (HS 160521, HS 160529):
- Jan: 4,675 MT = +61% YoY
- Feb: 3,759 MT = +12% YoY
- Mar: 3,970 MT = +26% YoY
- Apr: 4,224 MT = +24% YoY
- May: 4,934 MT = +14% YoY
- YTD (Jan–May): 21,561 MT = +26% YoY
Top Five Suppliers
- Ecuador:
- Jan: 12,514 MT = -3% YoY
- Feb: 13,550 MT = +31% YoY
- Mar: 19,364 MT = +72% YoY
- Apr: 19,008 MT = +32% YoY
- May: 24,188 MT = +39% YoY
- YTD (Jan–May): 88,625 MT = +34% YoY
- India:
- Jan: 4,848 MT = +68% YoY
- Feb: 4,084 MT = +15% YoY
- Mar: 4,006 MT = +24% YoY
- Apr: 3,608 MT = +8% YoY
- May: 4,817 MT = +25% YoY
- YTD (Jan–May): 21,363 MT = +26% YoY
- Vietnam:
- Jan: 4,484 MT = +41% YoY
- Feb: 3,300 MT = -13% YoY
- Mar: 3,417 MT = +13% YoY
- Apr: 3,557 MT = +33% YoY
- May: 4,791 MT = +53% YoY
- YTD (Jan–May): 19,549 MT = +23% YoY
- Venezuela:
- Jan: 2,811 MT = -45% YoY
- Feb: 1,231 MT = -61% YoY
- Mar: 2,788 MT = -23% YoY
- Apr: 1,483 MT = -55% YoY
- May: 1,996 MT = -9% YoY
- YTD (Jan–May): 10,309 MT = -41% YoY
- Bangladesh:
- Jan: 1,464 MT = +73% YoY
- Feb: 979 MT = -14% YoY
- Mar: 938 MT = +51% YoY
- Apr: 640 MT = -10% YoY
- May: 573 MT = -10% YoY
- YTD (Jan–May): 4,594 MT = +16% YoY