Totals
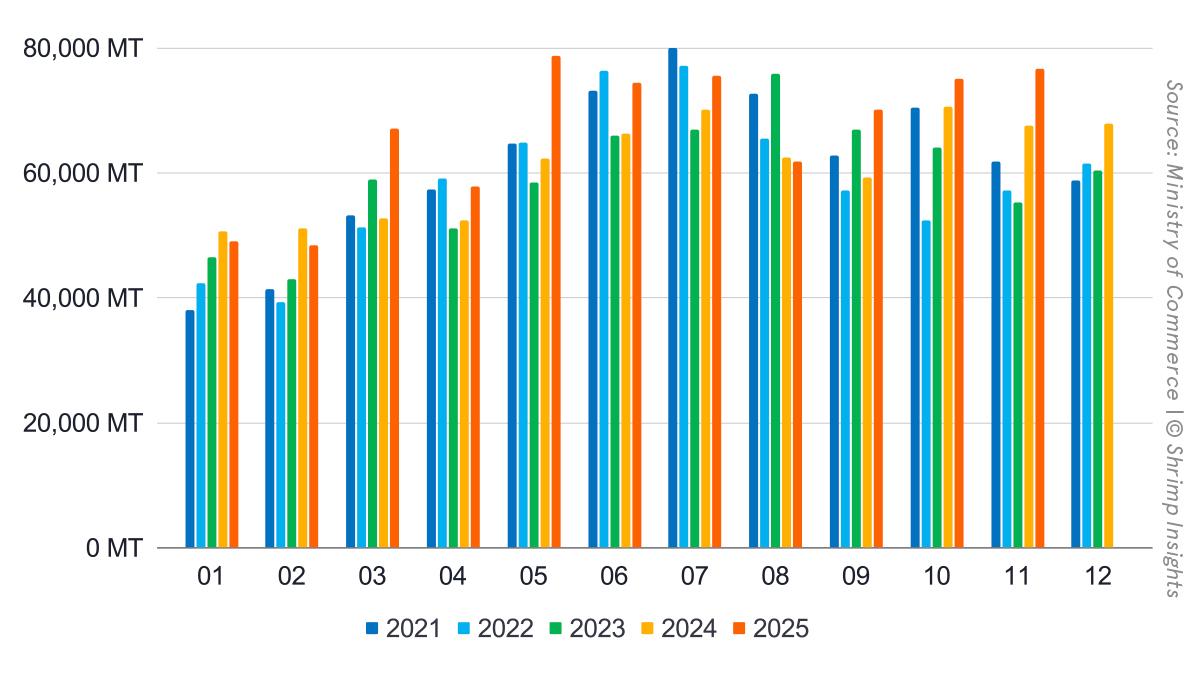
India’s shrimp exports show a clear upward trend in 2025, with YTD (Jan–Nov) volumes reaching 734,593 MT, up 10% YoY, while export value increased faster to USD 5.23 billion (+17% YoY). Growth was front-loaded and mid-year driven, but the imposition of higher US tariffs in October led to a visible shift in trade flows rather than an outright slowdown.
October and November volumes remained firm at 75,085 MT (+6% YoY) and 76,616 MT (+13% YoY) respectively, indicating that lost US demand was largely absorbed by alternative markets, keeping total exports on an upward trajectory toward year-end. It's important to keep in mind that, with a shift away from the US’s peeled market towards HLSO markets in China and Vietnam, part of the increase in export volume is likely due to a changing product mix rather than an increase in Live Weight Equivalent.
Products
At the product level, raw L. vannamei continues to dominate India’s export basket. YTD exports reached 562,382 MT (+9% YoY), supported by strong mid-year exports. Following the October tariff increase in the US, shipments in October (52,115 MT, +7% YoY) and November (54,985 MT, +11% YoY) held up well, suggesting redirection toward non-US markets rather than product-level contraction.
Value-added products remain the fastest-growing category on a YTD basis at 70,370 MT (+18% YoY). However, October (7,033 MT, -4% YoY) and November (7,077 MT, -1% YoY) point to some softening in higher-value items, which are more exposed to the US retail and foodservice segment affected by tariffs.
Wild-caught shrimp exports continued their structural decline, with YTD volumes down 3% YoY, and further weakness in October and November, reflecting both supply constraints and weaker demand in tariff-affected markets.
In contrast, raw P. monodon showed a pronounced second-half rebound. YTD volumes rose 35% YoY to 49,765 MT, with October (10,361 MT, +25% YoY) and November (9,369 MT, +73% YoY) benefiting from strong demand in Asia and the EU, largely insulated from US tariff measures.
Markets
From a market perspective, 2025 marks a clear turning point in India’s export geography, especially after US tariffs came into force in October.
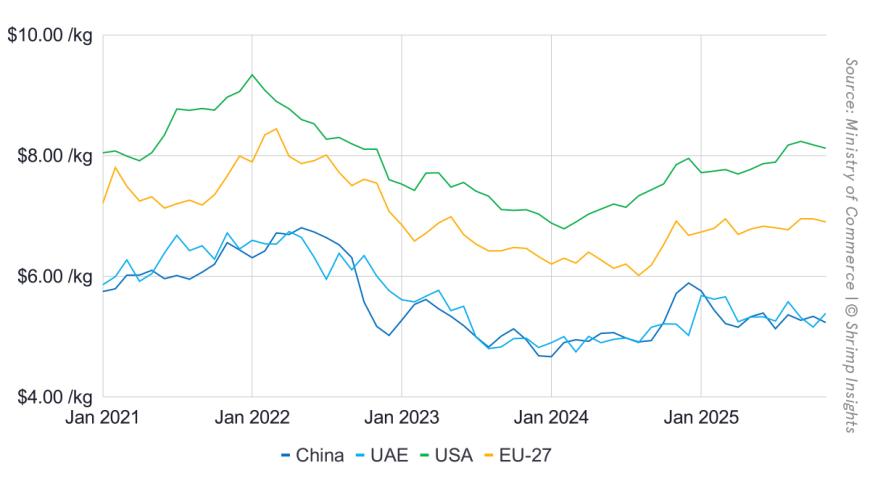
Exports to the USA were already under pressure earlier in the year and fell more sharply in Q4, with October volumes down 26% YoY and November down 18% YoY, bringing YTD exports to 258,749 MT (-6% YoY). This confirms the structural weakening of the US market for Indian shrimp under higher tariff conditions.
By contrast, China absorbed part of the redirected volume, with YTD imports up 10% YoY to 141,002 MT. Growth accelerated in October (+18% YoY) and November (+42% YoY), coinciding with reduced US intake.
The EU-27 emerged as the main beneficiary of the post-October rebalancing. YTD exports rose 38% YoY to 107,649 MT, while October and November volumes were up 79% and 58% YoY, respectively, underscoring the EU’s role as a key alternative outlet once US tariffs took effect.
Exports to Vietnam continued to expand strongly, reaching 64,022 MT YTD (+81% YoY), with October (+90% YoY) and November (+21% YoY) reflecting sustained regional demand and processing trade.
Japan showed steady growth throughout the year, with YTD exports up 7% YoY, and October and November growth remaining positive, suggesting limited exposure to US tariff dynamics.
EU–India Free Trade Agreement: what the announcement means for shrimp — and what comes next
The political announcement of the EU–India Free Trade Agreement marks an important milestone for India’s shrimp sector, particularly against the backdrop of weakening access to the US market since October. However, it is important to distinguish between a political conclusion of negotiations and the point at which exporters will see actual tariff relief at the border.
Following the announcement, the agreement enters a technical and legal phase. This includes legal scrubbing (ensuring consistency across all chapters), finalisation of tariff schedules and product annexes, translation into all EU languages, and ultimately ratification by EU institutions and member states, as well as by India. This process typically takes 12–24 months, meaning that entry into force before 2026 is unlikely, with 2026–2027 a more realistic window.
For shrimp exporters, the most critical documents are the tariff schedules, which specify for each HS line whether duties are:
- eliminated immediately at entry into force,
- reduced gradually over a defined transition period, or
- treated as “sensitive” and liberalised more slowly or partially.
At this stage, shrimp-specific commitments have not yet been made public. Based on precedents in other EU FTAs, seafood products — including shrimp — are often included, but rarely receive immediate duty-free access unless they are considered non-sensitive. A phased reduction over several years is therefore the most plausible outcome for shrimp, rather than an instant move to zero duty.
Shrimp precedents in EU FTAs provide useful guidance for India and Indonesia. Under the EU–Vietnam FTA, shrimp was clearly included: raw shrimp entered at zero duty at the time of entry into force, while processed/value-added shrimp followed a longer, staged tariff phase-out, reaching full liberalisation only after several years. This created an immediate boost in competitiveness for Vietnamese raw shrimp, with a more gradual improvement for processed products. In contrast, Ecuador’s access under the EU’s multipartite agreement with Colombia and Peru did not hinge on a single headline tariff cut for shrimp; instead, shrimp benefited from broad tariff elimination across “almost all goods” from 2017 onward, effectively locking in stable, preferential access and reducing long-term policy risk rather than delivering a sudden step-change. Looking ahead, Indonesia is widely expected to follow a Vietnam-like model once its EU FTA is concluded: shrimp is very likely to be included, with raw shrimp liberalised faster and processed shrimp subject to longer staging, reflecting EU sensitivity around value-added seafood. Taken together, these precedents suggest that for India as well, shrimp inclusion is likely, but a phased approach—especially for processed products—is the most realistic outcome.
While the FTA does not change the competitive landscape overnight, it materially improves the medium-term outlook for Indian shrimp in the EU. Even a gradual tariff phase-out would enhance India’s position vis-à-vis suppliers that do not benefit from similar preferences, and it would reinforce the structural shift toward Europe that has already become visible in October–November trade data following the US tariff increase.
In this context, the EU–India FTA should be seen less as an immediate volume catalyst and more as a strategic anchor: it reduces long-term policy risk, supports investment planning, and strengthens the case for the EU as a core destination market for Indian shrimp, given that access to the US remains uncertain.
Byte in Numbers
Total Shrimp Exports (HS 030617, HS 160521, HS 160529)
- Volume:
- Jan: 49,058 MT = -3% YoY
- Feb: 48,383 MT = -5% YoY
- Mar: 67,022 MT = +27% YoY
- Apr: 57,800 MT = +10% YoY
- May: 78,753 MT = +26% YoY
- Jun: 74,405 MT = +12% YoY
- Jul: 75,508 MT = +8% YoY
- Aug: 61,842 MT = -1% YoY
- Sep: 70,121 MT = +18% YoY
- Oct: 75,085 MT = +6% YoY
- Nov: 76,616 MT = +13% YoY
- YTD (Jan–Nov): 734,593 MT = +10% YoY
- Value:
- Jan: $355 million = +9% YoY
- Feb: $348 million = +5% YoY
- Mar: $471 million = +39% YoY
- Apr: $401 million = +19% YoY
- May: $547 million = +35% YoY
- Jun: $513 million = +20% YoY
- Jul: $533 million = +16% YoY
- Aug: $440 million = +3% YoY
- Sep: $508 million = +21% YoY
- Oct: $569 million = +13% YoY
- Nov: $543 million = +11% YoY
- YTD (Jan–Nov): $5,227 million = +17% YoY
Products
- Raw L. vannamei:
- Jan: 35,786 MT = -8% YoY
- Feb: 36,001 MT = -8% YoY
- Mar: 53,286 MT = +30% YoY
- Apr: 47,291 MT = +10% YoY
- May: 65,863 MT = +26% YoY
- Jun: 63,133 MT = +12% YoY
- Jul: 61,609 MT = +7% YoY
- Aug: 44,932 MT = -5% YoY
- Sep: 47,383 MT = +14% YoY
- Oct: 52,115 MT = +7% YoY
- Nov: 54,985 MT = +11% YoY
- YTD (Jan–Nov): 562,382 MT = +9% YoY
- Value-added:
- Jan: 5,631 MT = +38% YoY
- Feb: 6,064 MT = +31% YoY
- Mar: 6,598 MT = +41% YoY
- Apr: 4,937 MT = +27% YoY
- May: 7,342 MT = +54% YoY
- Jun: 6,787 MT = +33% YoY
- Jul: 7,012 MT = +17% YoY
- Aug: 5,403 MT = -10% YoY
- Sep: 6,486 MT = +7% YoY
- Oct: 7,033 MT = -4% YoY
- Nov: 7,077 MT = -1% YoY
- YTD (Jan–Nov): 70,370 MT = +18% YoY
- Wild-caught:
- Jan: 5,216 MT = -0% YoY
- Feb: 5,042 MT = -3% YoY
- Mar: 5,664 MT = +11% YoY
- Apr: 4,347 MT = +18% YoY
- May: 4,225 MT = +15% YoY
- Jun: 3,444 MT = -1% YoY
- Jul: 3,930 MT = -18% YoY
- Aug: 4,669 MT = -16% YoY
- Sep: 4,780 MT = -10% YoY
- Oct: 5,575 MT = -12% YoY
- Nov: 5,185 MT = -7% YoY
- YTD (Jan–Nov): 52,076 MT = -3% YoY
- Raw P. monodon:
- Jan: 2,425 MT = -0% YoY
- Feb: 1,276 MT = -45% YoY
- Mar: 1,475 MT = -26% YoY
- Apr: 1,225 MT = -27% YoY
- May: 1,323 MT = -27% YoY
- Jun: 1,042 MT = -26% YoY
- Jul: 2,958 MT = +99% YoY
- Aug: 6,839 MT = +83% YoY
- Sep: 11,471 MT = +85% YoY
- Oct: 10,361 MT = +25% YoY
- Nov: 9,369 MT = +73% YoY
- YTD (Jan–Nov): 49,765 MT = +35% YoY
Top Five Markets
- USA:
- Jan: 21,724 MT = +6% YoY
- Feb: 21,896 MT = -3% YoY
- Mar: 26,886 MT = +32% YoY
- Apr: 22,760 MT = +14% YoY
- May: 32,931 MT = +28% YoY
- Jun: 26,693 MT = +5% YoY
- Jul: 27,578 MT = -9% YoY
- Aug: 16,587 MT = -42% YoY
- Sep: 17,610 MT = -33% YoY
- Oct: 21,405 MT = -26% YoY
- Nov: 22,257 MT = -18% YoY
- YTD (Jan–Nov): 258,749 MT = -6% YoY
- China:
- Jan: 5,247 MT = -45% YoY
- Feb: 5,112 MT = -40% YoY
- Mar: 10,908 MT = +13% YoY
- Apr: 10,286 MT = -12% YoY
- May: 17,337 MT = +20% YoY
- Jun: 16,187 MT = -5% YoY
- Jul: 12,092 MT = +5% YoY
- Aug: 12,190 MT = +33% YoY
- Sep: 15,337 MT = +76% YoY
- Oct: 16,161 MT = +18% YoY
- Nov: 20,146 MT = +42% YoY
- YTD (Jan–Nov): 141,002 MT = +10% YoY
- EU-27:
- Jan: 7,303 MT = +21% YoY
- Feb: 7,537 MT = +27% YoY
- Mar: 8,297 MT = +17% YoY
- Apr: 7,822 MT = +36% YoY
- May: 8,060 MT = +24% YoY
- Jun: 8,488 MT = +33% YoY
- Jul: 10,780 MT = +32% YoY
- Aug: 11,083 MT = +58% YoY
- Sep: 11,873 MT = +79% YoY
- Oct: 11,873 MT = +79% YoY
- Nov: 12,305 MT = +58% YoY
- YTD (Jan–Nov): 107,649 MT = +38% YoY
- Vietnam:
- Jan: 3,568 MT = +30% YoY
- Feb: 2,805 MT = +30% YoY
- Mar: 6,755 MT = +89% YoY
- Apr: 5,180 MT = +50% YoY
- May: 6,747 MT = +131% YoY
- Jun: 7,133 MT = +97% YoY
- Jul: 6,901 MT = +140% YoY
- Aug: 5,038 MT = +264% YoY
- Sep: 6,343 MT = +86% YoY
- Oct: 6,727 MT = +90% YoY
- Nov: 6,826 MT = +21% YoY
- YTD (Jan–Nov): 64,022 MT = +81% YoY
- Japan:
- Jan: 2,299 MT = -14% YoY
- Feb: 2,005 MT = -9% YoY
- Mar: 3,210 MT = +46% YoY
- Apr: 2,435 MT = +35% YoY
- May: 3,152 MT = +8% YoY
- Jun: 3,322 MT = -11% YoY
- Jul: 4,512 MT = +0% YoY
- Aug: 4,220 MT = -20% YoY
- Sep: 5,286 MT = +47% YoY
- Oct: 4,100 MT = +9% YoY
- Nov: 3,157 MT = +23% YoY
- YTD (Jan–Nov): 37,697 MT = +7% YoY