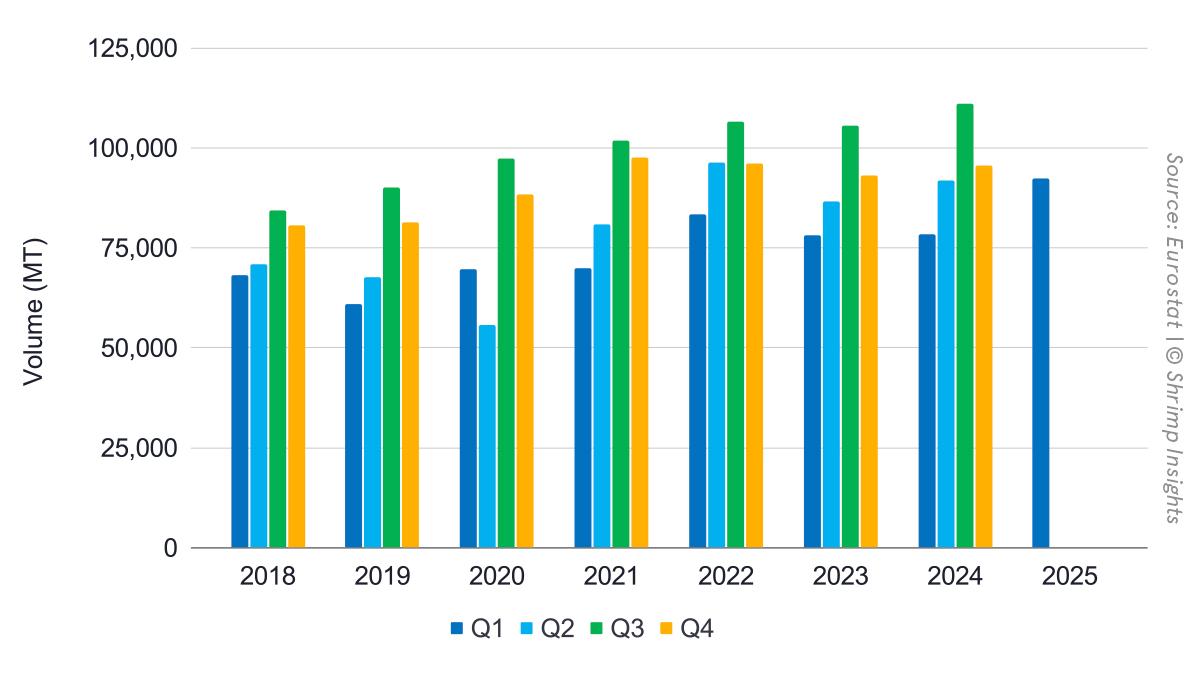
In Q1 2025, the EU imported 92,413 MT of raw frozen Penaeus shrimp and value-added shrimp from Asia, Latin America, and Africa, 11% more than the previous record from 2022. While in January and February, the import volume increased by 8% each, in March, it increased by 39%, bringing the year total 11% ahead of the previous record from 2022 and 18% ahead of the same period in 2024.
Looking at the different parts of the EU, in the Southern part, after a slow start in January, imports surged year over year in February (+15%) and March (+42%). The year total in the EU’s largest market is now 17% ahead of 2024. Imports in the Northwestern part are ahead by even 22% year over year, and imports fell by 13% in the Eastern part. Raw frozen shrimp grew by 16% yearly, while value-added shrimp imports grew by 32%, showing the growing appetite for cooked, marinated, and other value-added items.
Ecuador (+32%) and India (+34%) primarily accounted for the import surge, but supplies from Vietnam and Bangladesh also increased. Only Venezuela saw its supplies to the EU drop further.
Total Raw Frozen Penaeus (HS 03061792) and Value-Added (HS 160521, 160529) from Asia, Latin America, and Africa.
- Volume:
- Jan: 30,604.1 MT = +8% YoY
- Feb: 26,849.2 MT = +8% YoY
- Mar: 34,960.2 MT = +39% YoY
- Q1: 92,413.5 MT = +18% YoY
- Value:
- Jan: 212.4 mln EUR = +26% YoY
- Feb: 184.0 mln EUR = +21% YoY
- Mar: 231.7 mln EUR = +56% YoY
- Q1: 628.1 mln EUR = +34% YoY
Import Regions of Raw Frozen Penaeus (HS 03061792) and Value-Added (HS 160521, 160529) from Asia, Latin America, and Africa.
- Southern EU
- Jan: 15,997.8 MT = -4% YoY
- Feb: 16,251.9 MT = +15% YoY
- Mar: 22,402.0 MT = +42% YoY
- Q1: 54,651.6 MT = +17% YoY
- Northwestern EU
- Jan: 13,649.5 MT = +30% YoY
- Feb: 9,818.6 MT = -2% YoY
- Mar: 11,860.8 MT = +37% YoY
- Q1: 35,328.9 MT = +21% YoY
- Eastern EU
- Jan: 956.8 MT = -14% YoY
- Feb: 778.7 MT = -10% YoY
- Mar: 697.4 MT = -16% YoY
- Q1: 2,432.9 MT = -13% YoY
Products
- Raw Frozen Penaeus Shrimp (HS 03061792)
- Jan: 25,928.9 MT = +2% YoY
- Feb: 23,090.0 MT = +7% YoY
- Mar: 30,990.5 MT = +40% YoY
- Q1: 80,009.4 MT = +16% YoY
- Value-Added (HS 160521, HS 160529)
- Jan: 4,675.1 MT = +61% YoY
- Feb: 3,759.2 MT = +12% YoY
- Mar: 3,969.8 MT = +26% YoY
- Q1: 12,404.0 MT = +32% YoY
Top Five Suppliers
- Ecuador
- Jan: 12,514.2 MT = -3% YoY
- Feb: 13,550.5 MT = +31% YoY
- Mar: 19,364.2 MT = +72% YoY
- Q1: 45,428.9 MT = +32% YoY
- India
- Jan: 4,847.8 MT = +68% YoY
- Feb: 4,084.2 MT = +15% YoY
- Mar: 4,005.7 MT = +24% YoY
- Q1: 12,937.7 MT = +34% YoY
- Vietnam
- Jan: 4,483.5 MT = +41% YoY
- Feb: 3,300.5 MT = -13% YoY
- Mar: 3,417.1 MT = +13% YoY
- Q1: 11,201.0 MT = +12% YoY
- Venezuela
- Jan: 2,811.5 MT = -45% YoY
- Feb: 1,230.8 MT = -61% YoY
- Mar: 2,788.4 MT = -23% YoY
- Q1: 6,830.6 MT = -42% YoY
- Bangladesh
- Jan: 1,464.2 MT = +73% YoY
- Feb: 978.6 MT = -14% YoY
- Mar: 937.9 MT = +51% YoY
- Q1: 3,380.8 MT = +29% YoY
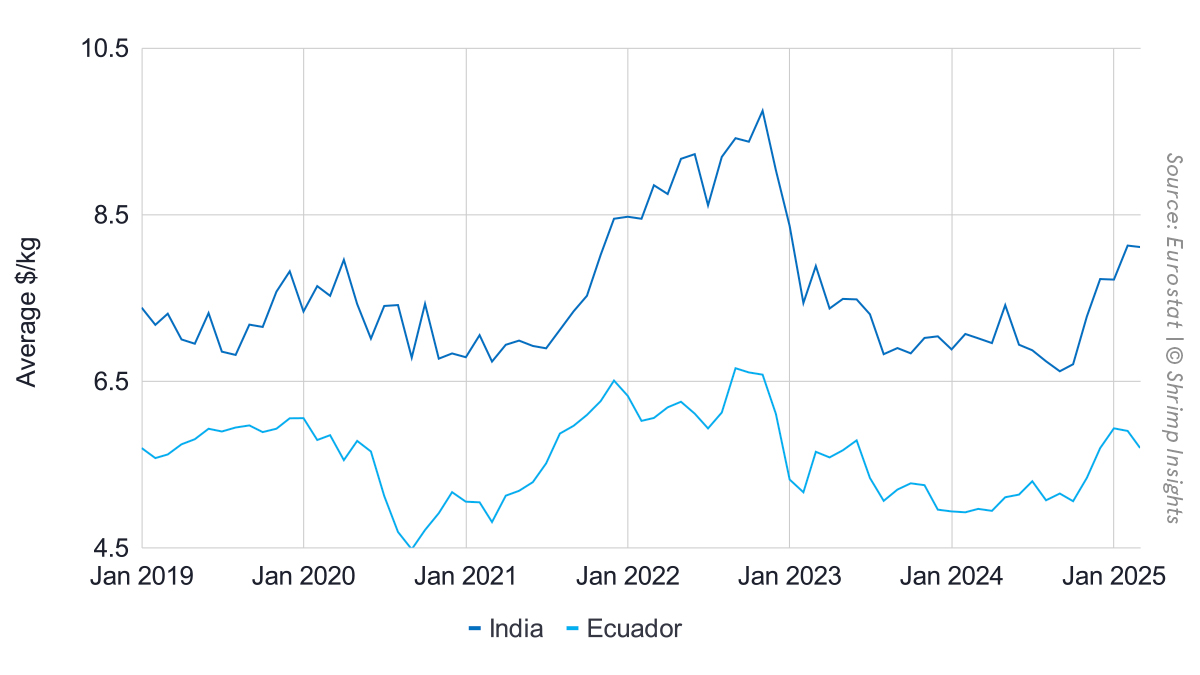
The average import values per kg are still above the same period in 2024, but they are slightly down compared to the last months of 2024. The graph below details this.