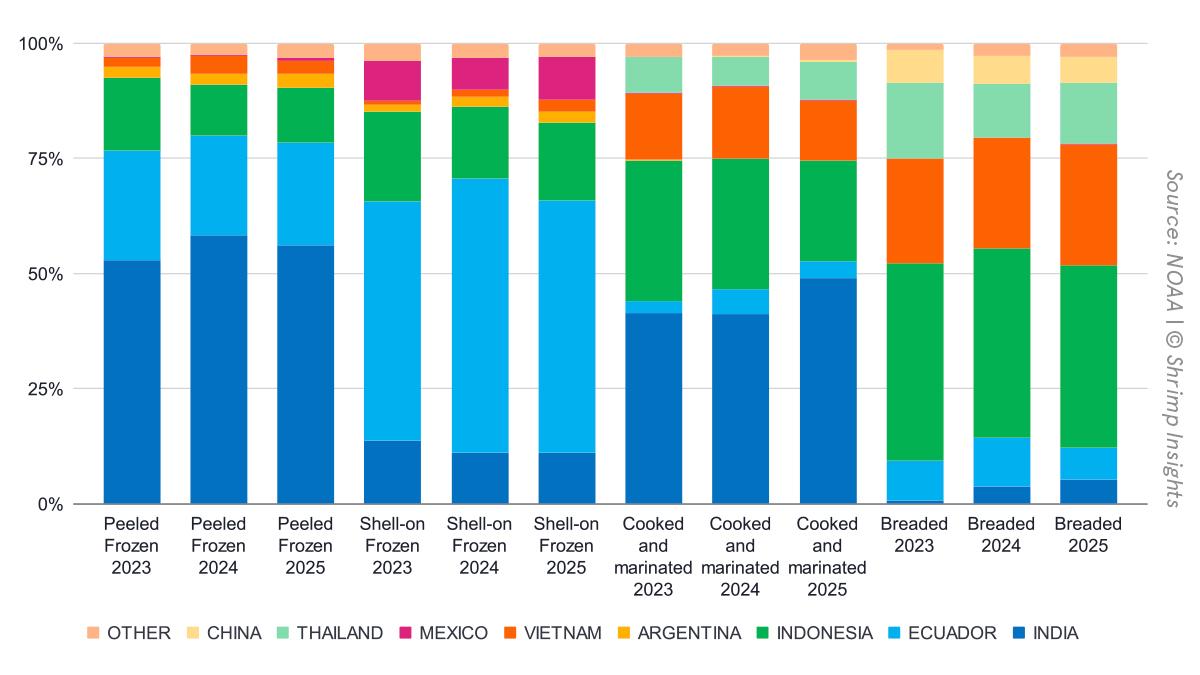
US imports in January, February, and March 2025 outperformed those months in 2024 by 20%, 8%, and 11%. The year total reached 205,770 MT, 13% up from 2024. The increase in imports has mainly been achieved by the imports of peeled frozen (+19%), cooked and marinated (+34%), and breaded (+11%) shrimp. Imports of frozen shell-on shrimp dropped by 6%. The central countries contributing to the growth are India (+20%), Indonesia (+12%), Vietnam (+10%), Thailand (+42%), Mexico (+38%), and Argentina (+35%). Ecuador, on the other hand, dropped 2%. Some more details below.
Total:
- Volume:
- January: 71,412 MT = +20% YoY
- February: 64,145 MT = +8% YoY
- March: 70,214 MT = +11% YoY
- Q1: 205,770 MT = +13% YoY
- Value:
- January: 604.0 mln USD = +31% YoY
- February: 530.9 mln USD = +16% YoY
- March: 576.7 mln USD = +20% YoY
- Q1: 1,711.6 mln USD = +22% YoY
Products:
- Peeled frozen:
- January: 35,949 MT = +39% YoY
- February: 32,175 MT = +8% YoY
- March: 34,033 MT = +13% YoY
- Q1: 102,157 MT = +19% YoY
- Shell-on frozen:
- January: 18,068 MT = -9% YoY
- February: 16,793 MT = -3% YoY
- March: 20,452 MT = -4% YoY
- Q1: 55,314 MT = -6% YoY
- Cooked and marinated:
- January: 11,757 MT = +42% YoY
- February: 9,776 MT = +27% YoY
- March: 9,987 MT = +32% YoY
- Q1: 31,521 MT = +34% YoY
- Breaded:
- January: 5,078 MT = +0% YoY
- February: 4,768 MT = +10% YoY
- March: 5,132 MT = +25% YoY
- Q1: 14,978 MT = +11% YoY
Countries (top five):
- India:
- January: 31,165 MT = +55% YoY
- February: 24,641 MT = +4% YoY
- March: 24,937 MT = +7% YoY
- Q1: 80,743 MT = +20% YoY
- Ecuador:
- January: 15,301 MT = -13% YoY
- February: 17,804 MT = +5% YoY
- March: 22,304 MT = +3% YoY
- Q1: 55,409 MT = -2% YoY
- Indonesia:
- January: 11,534 MT = +1% YoY
- February: 10,469 MT = +5% YoY
- March: 12,563 MT = +32% YoY
- Q1: 34,566 MT = +12% YoY
- Vietnam:
- January: 4,963 MT = +35% YoY
- February: 3,690 MT = +1% YoY
- March: 3,624 MT = -6% YoY
- Q1: 12,277 MT = +10% YoY
- Thailand:
- January: 2,392 MT = +21% YoY
- February: 2,129 MT = +66% YoY
- March: 2,240 MT = +48% YoY
- Q1: 6,761 MT = +42% YoY
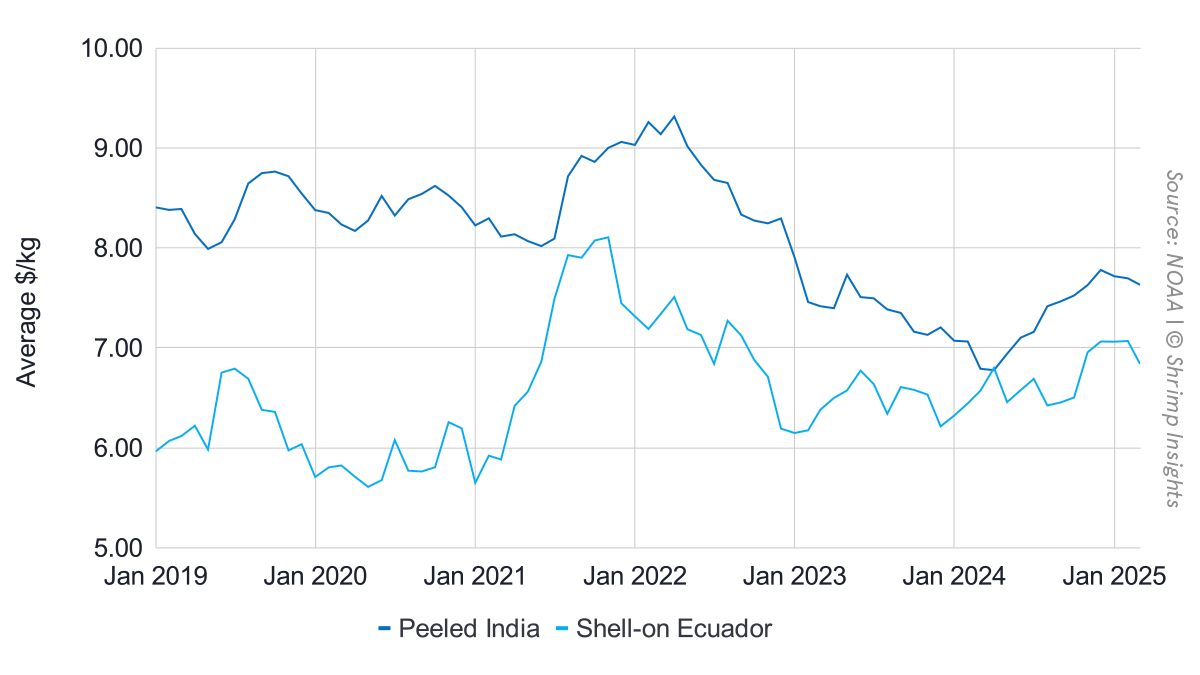
While the volume has grown, the average import value has stagnated and is even slightly declining. This is the case for Ecuador, shell-on, and India, peeled. This raises the question of whether the increase in volume has been demand- or supply-driven and whether the market is building another inventory that could at some point result in oversupply and downward price pressure. This said, prices are still considerably above the prices of the same period in 2024.