Total
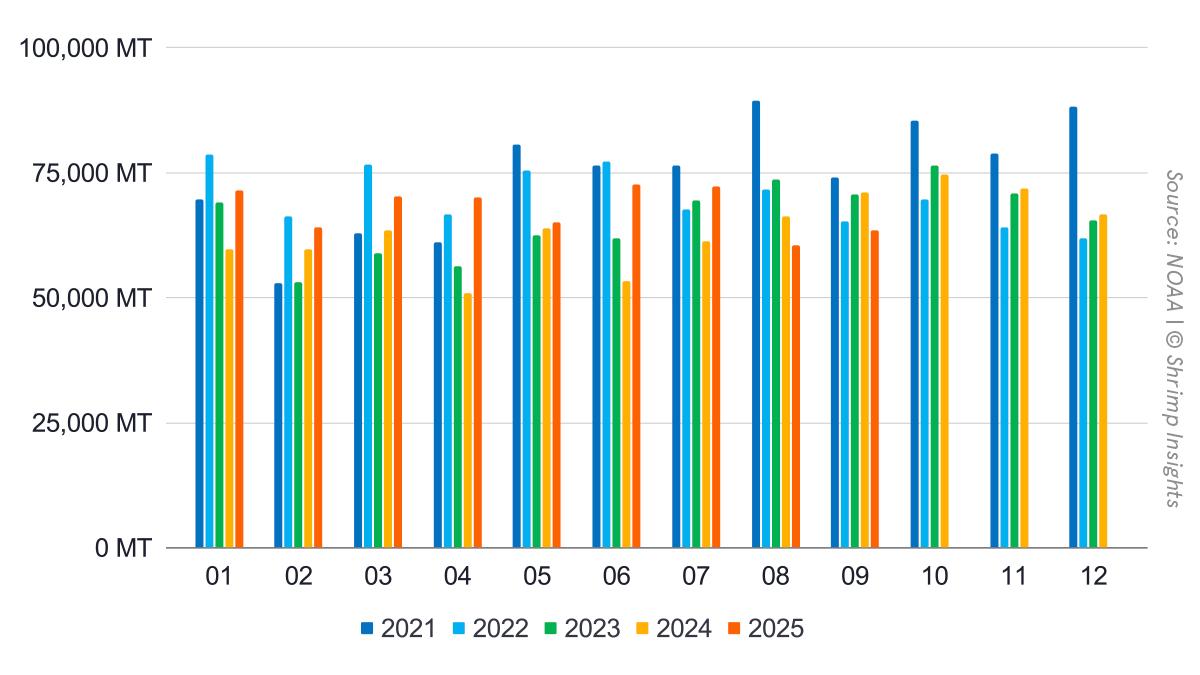
US shrimp imports closed the first nine months of the year at 610,041 MT, up 11% year-on-year. Growth was broad-based and robust in the first half, with monthly volumes expanding at double-digit rates from January through July, peaking in April (+38%) and June (+36%). This positive trend was interrupted in late summer by the reciprocal tariffs taking effect. August volumes declined 9% year-on-year, followed by a deeper 11% contraction in September, marking a clear break from the pre-tariff strong first-half momentum.
In value terms, performance remained stronger than volume. Total import value reached USD 5.07 billion year-to-date, up 18% year-on-year. January through July all posted double-digit growth, with robust gains in April and June (both +47%). As with volumes, momentum weakened in August and September, when values fell 6% and 8% year-on-year, respectively, reflecting lower volumes and easing prices.
Products
Peeled frozen shrimp continued to dominate the US import basket and drove much of the year’s growth. Imports reached 318,625 MT in January–September, up 15% year-on-year. Volumes expanded strongly through July, with growth peaking in June at +46%, before turning negative in August (-6%) and September (-12%).
Shell-on frozen shrimp showed a much flatter trend. Year-to-date volumes reached 151,396 MT, up just 2% year-on-year. While April (+52%) and June (+20%) stood out as strong months, most other months hovered around or below last year’s levels, and late-summer volumes again weakened.
Value-added categories continued to outperform raw formats. Cooked and marinated shrimp reached 90,532 MT year-to-date, up 16% year-on-year, with solid growth through June followed by declines in August and September. Breaded shrimp volumes totaled 44,198 MT, up 3% year-on-year. After a strong March and June, imports in this category also lost momentum in the third quarter, with double-digit declines in August and September.
Top Five Origins
For India, January–September volumes reached 245,476 MT, despite a year-on-year decline in September still up 15% year-on-year. Growth was robust in the first half, with the most substantial gains in January (+55%) and June (+44%). Momentum slowed later in the year, with August volumes barely above last year and September falling 11% year-on-year.
Ecuador continued its steady expansion in the US market, shipping 166,133 MT in the first nine months, up 16% year over year. April stood out with a doubling of volumes (+102%), while growth remained positive in most subsequent months, including a strong September (+22%), making Ecuador one of the few major origins still accelerating late in the period. Of course, this relates to Ecuador’s favorable position on reciprocal tariffs.
Indonesia posted more modest growth. Year-to-date volumes reached 99,562 MT, up 6% year over year. Substantial gains in March, April, and June were offset by sharp declines in August (-23%) and September (-31%), eroding much of the earlier momentum. This drop is primarily due to the Cesium-134 situation, which persists to date. A review of BL data for Indonesia’s shipments to the US suggests that October and November imports may drop by 75-85%.
Vietnam continued to lose ground in the US market. Imports declined 9% year-on-year to 43,281 MT in January–September. After a strong January and a spike in June (+52%), volumes dropped sharply in the third quarter, with August and September down 46% and 35% respectively.
Thailand showed limited but positive growth overall. Year-to-date volumes reached 18,155 MT, up 7% year over year. Early-year growth was solid, but volumes weakened noticeably from July onwards, culminating in a 34% year-on-year decline in September.
Byte in Numbers
Totals
- Volume
- Jan: 71,412 MT = +20% YoY
- Feb: 64,145 MT = +8% YoY
- Mar: 70,214 MT = +11% YoY
- Apr: 70,141 MT = +38% YoY
- May: 65,044 MT = +2% YoY
- Jun: 72,763 MT = +36% YoY
- Jul: 72,352 MT = +18% YoY
- Aug: 60,551 MT = -9% YoY
- Sep: 63,421 MT = -11% YoY
- YTD (Jan–Sep): 610,041 MT = +11% YoY
- Value
- Jan: $604 million = +31% YoY
- Feb: $531 million = +16% YoY
- Mar: $577 million = +20% YoY
- Apr: $586 million = +47% YoY
- May: $538 million = +11% YoY
- Jun: $613 million = +47% YoY
- Jul: $595 million = +24% YoY
- Aug: $501 million = -6% YoY
- Sep: $528 million = -8% YoY
- YTD (Jan–Sep): $5,073 million = +18% YoY
Products
- Peeled Frozen
- Jan: 35,949 MT = +39% YoY
- Feb: 32,175 MT = +8% YoY
- Mar: 34,033 MT = +13% YoY
- Apr: 35,695 MT = +38% YoY
- May: 35,357 MT = +13% YoY
- Jun: 37,940 MT = +46% YoY
- Jul: 39,838 MT = +22% YoY
- Aug: 34,023 MT = -6% YoY
- Sep: 33,616 MT = -12% YoY
- YTD (Jan–Sep): 318,625 MT = +15% YoY
- Shell-On Frozen
- Jan: 18,068 MT = -9% YoY
- Feb: 16,793 MT = -3% YoY
- Mar: 20,452 MT = -4% YoY
- Apr: 17,988 MT = +52% YoY
- May: 15,960 MT = -12% YoY
- Jun: 17,127 MT = +20% YoY
- Jul: 16,729 MT = +19% YoY
- Aug: 13,211 MT = -15% YoY
- Sep: 15,067 MT = -5% YoY
- YTD (Jan–Sep): 151,396 MT = +2% YoY
- Cooked and Marinated
- Jan: 11,757 MT = +42% YoY
- Feb: 9,776 MT = +27% YoY
- Mar: 9,987 MT = +32% YoY
- Apr: 10,573 MT = +25% YoY
- May: 9,043 MT = +3% YoY
- Jun: 10,882 MT = +41% YoY
- Jul: 10,132 MT = +8% YoY
- Aug: 8,873 MT = -6% YoY
- Sep: 9,507 MT = -12% YoY
- YTD (Jan–Sep): 90,532 MT = +16% YoY
- Breaded
- Jan: 5,078 MT = +0% YoY
- Feb: 4,768 MT = +10% YoY
- Mar: 5,132 MT = +25% YoY
- Apr: 5,151 MT = +15% YoY
- May: 4,239 MT = -15% YoY
- Jun: 6,259 MT = +35% YoY
- Jul: 4,985 MT = +7% YoY
- Aug: 3,944 MT = -18% YoY
- Sep: 4,642 MT = -18% YoY
- YTD (Jan–Sep): 44,198 MT = +3% YoY
Top Five Origins
- India
- Jan: 31,165 MT = +55% YoY
- Feb: 24,641 MT = +4% YoY
- Mar: 24,937 MT = +7% YoY
- Apr: 26,611 MT = +26% YoY
- May: 25,903 MT = +16% YoY
- Jun: 28,577 MT = +44% YoY
- Jul: 30,717 MT = +15% YoY
- Aug: 26,550 MT = +1% YoY
- Sep: 26,374 MT = -11% YoY
- YTD (Jan–Sep): 245,476 MT = +15% YoY
- Ecuador
- Jan: 15,301 MT = -13% YoY
- Feb: 17,804 MT = +5% YoY
- Mar: 22,304 MT = +3% YoY
- Apr: 19,952 MT = +102% YoY
- May: 19,773 MT = +3% YoY
- Jun: 17,958 MT = +32% YoY
- Jul: 18,149 MT = +41% YoY
- Aug: 16,123 MT = +4% YoY
- Sep: 18,770 MT = +22% YoY
- YTD (Jan–Sep): 166,133 MT = +16% YoY
- Indonesia
- Jan: 11,534 MT = +1% YoY
- Feb: 10,469 MT = +5% YoY
- Mar: 12,563 MT = +32% YoY
- Apr: 13,925 MT = +34% YoY
- May: 9,249 MT = -21% YoY
- Jun: 13,219 MT = +44% YoY
- Jul: 12,704 MT = +23% YoY
- Aug: 8,438 MT = -23% YoY
- Sep: 7,460 MT = -31% YoY
- YTD (Jan–Sep): 99,562 MT = +6% YoY
- Vietnam
- Jan: 4,963 MT = +35% YoY
- Feb: 3,690 MT = +1% YoY
- Mar: 3,624 MT = -6% YoY
- Apr: 3,946 MT = -3% YoY
- May: 4,917 MT = -4% YoY
- Jun: 7,790 MT = +52% YoY
- Jul: 4,622 MT = -20% YoY
- Aug: 4,169 MT = -46% YoY
- Sep: 5,561 MT = -35% YoY
- YTD (Jan–Sep): 43,281 MT = -9% YoY
- Thailand
- Jan: 2,392 MT = +21% YoY
- Feb: 2,129 MT = +66% YoY
- Mar: 2,240 MT = +48% YoY
- Apr: 2,233 MT = +10% YoY
- May: 1,521 MT = -18% YoY
- Jun: 2,301 MT = +17% YoY
- Jul: 2,151 MT = -8% YoY
- Aug: 1,608 MT = -3% YoY
- Sep: 1,581 MT = -34% YoY
- YTD (Jan–Sep): 18,155 MT = +7% YoY