Strong Start to 2025, Though May Growth Slows
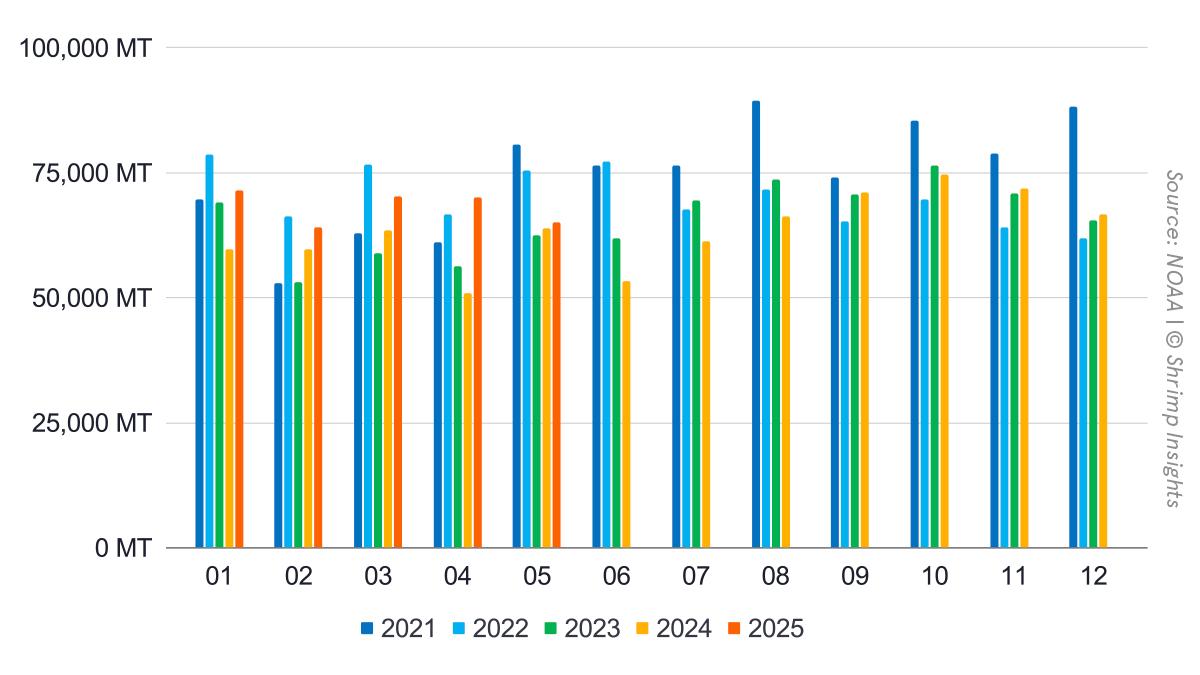
Between January and May 2025, the United States imported 340,955 metric tons (MT) of shrimp, up 15% compared to the same period last year. Import volumes remained steady throughout the first five months, ranging between 64,000–71,000 MT. April posted the strongest YoY growth at +38%, but May saw a slowdown, with just 65,044 MT imported—only 2% more than in May 2024.
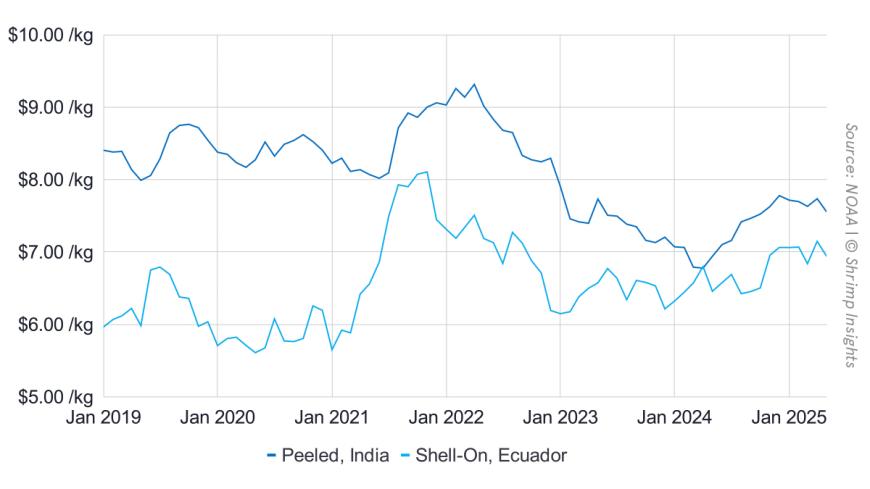
In value terms, total shrimp imports reached $2.84 billion YTD, up 24% YoY. Each month showed solid year-on-year gains, with April once again standing out (+47%). While May value growth also slowed relative to earlier months, it still rose 11% YoY to $538 million, suggesting average prices remained firm.
The data indicate that while overall import performance in 2025 remains strong, the pace of growth moderated in May, particularly in terms of volume.
Peeled Products Continue to Lead, Shell-On Sees Mixed Performance
Peeled frozen shrimp remained the mainstay of US imports, reaching 173,209 MT YTD, up 21% YoY. May imports remained stable at 35,357 MT, reflecting a 13% increase over the same period last year.
Shell-on frozen shrimp showed a less consistent pattern. After a surge in April (+52%), volumes dropped in May to 15,960 MT, down 12% YoY. Despite this fluctuation, total YTD imports rose 1%.
Cooked and marinated shrimp maintained solid growth, totaling 51,138 MT (+25% YoY). However, May imports slowed to 9,043 MT (+3%), a notable deceleration after four consecutive months of double-digit YoY growth.
Breaded shrimp imports reached 24,367 MT YTD (+6%), but May marked the weakest month so far this year at 4,239 MT, down 15% YoY.
Overall, the May data show a cooling trend across all product categories, with peeled shrimp performing the most steadily, while the shell-on and breaded categories saw year-on-year declines.
India and Ecuador Strengthen Positions, Indonesia Slips in May
India remained the largest supplier to the US market, with YTD exports of 133,257 MT (+21%). May shipments reached 25,903 MT, up 16% YoY, continuing a consistent growth trend.
Ecuador rebounded strongly after a weak January, with April marking a peak (+102%). May volumes held steady at 19,773 MT (+3%), bringing the YTD total to 95,133 MT (+11%).
Indonesia posted robust growth through April, but May shipments dropped to 9,249 MT, down 21% YoY. Still, the country ended May with 57,740 MT exported YTD, a 9% increase overall.
Vietnam recorded a total of 21,140 MT (+4%), with May at 4,917 MT (-4%). The country’s performance has softened over the last three months.
Thailand experienced a strong first quarter, but May volumes dropped to 1,521 MT (-18%), which pulled down the momentum. Nevertheless, the country is still up 22% YTD with 10,515 MT exported.
While India and Ecuador continued their strong performance into May, several other top origins experienced notable slowdowns. Whether this signals a broader adjustment in supply in response to Trump’s expected tariff decisions is unclear. Generally speaking, as Angel Rubio of Expana by Urner Barry has signaled in recent commentaries, the 2025 surge in US imports is primarily not a reflection of a rise in US demand, but rather a result of tariff-related supply and demand adjustments.
Byte in Numbers
Total
- Volume
- Jan: 71,412 MT = +20% YoY
- Feb: 64,145 MT = +8% YoY
- Mar: 70,214 MT = +11% YoY
- Apr: 70,141 MT = +38% YoY
- May: 65,044 MT = +2% YoY
- YTD (Jan–May): 340,955 MT = +15% YoY
- Value
- Jan: $604 million = +31% YoY
- Feb: $531 million = +16% YoY
- Mar: $577 million = +20% YoY
- Apr: $586 million = +47% YoY
- May: $538 million = +11% YoY
- YTD (Jan–May): $2,836 million = +24% YoY
Products
- Peeled Frozen
- Jan: 35,949 MT = +39% YoY
- Feb: 32,175 MT = +8% YoY
- Mar: 34,033 MT = +13% YoY
- Apr: 35,695 MT = +38% YoY
- May: 35,357 MT = +13% YoY
- YTD (Jan–May): 173,209 MT = +21% YoY
- Shell-On Frozen
- Jan: 18,068 MT = -9% YoY
- Feb: 16,793 MT = -3% YoY
- Mar: 20,452 MT = -4% YoY
- Apr: 17,988 MT = +52% YoY
- May: 15,960 MT = -12% YoY
- YTD (Jan–May): 89,262 MT = +1% YoY
- Cooked and Marinated
- Jan: 11,757 MT = +42% YoY
- Feb: 9,776 MT = +27% YoY
- Mar: 9,987 MT = +32% YoY
- Apr: 10,573 MT = +25% YoY
- May: 9,043 MT = +3% YoY
- YTD (Jan–May): 51,138 MT = +25% YoY
- Breaded
- Jan: 5,078 MT = +0% YoY
- Feb: 4,768 MT = +10% YoY
- Mar: 5,132 MT = +25% YoY
- Apr: 5,151 MT = +15% YoY
- May: 4,239 MT = -15% YoY
- YTD (Jan–May): 24,367 MT = +6% YoY
Top Five Origins
- India
- Jan: 31,165 MT = +55% YoY
- Feb: 24,641 MT = +4% YoY
- Mar: 24,937 MT = +7% YoY
- Apr: 26,611 MT = +26% YoY
- May: 25,903 MT = +16% YoY
- YTD (Jan–May): 133,257 MT = +21% YoY
- Ecuador
- Jan: 15,301 MT = -13% YoY
- Feb: 17,804 MT = +5% YoY
- Mar: 22,304 MT = +3% YoY
- Apr: 19,952 MT = +102% YoY
- May: 19,773 MT = +3% YoY
- YTD (Jan–May): 95,133 MT = +11% YoY
- Indonesia
- Jan: 11,534 MT = +1% YoY
- Feb: 10,469 MT = +5% YoY
- Mar: 12,563 MT = +32% YoY
- Apr: 13,925 MT = +34% YoY
- May: 9,249 MT = -21% YoY
- YTD (Jan–May): 57,740 MT = +9% YoY
- Vietnam
- Jan: 4,963 MT = +35% YoY
- Feb: 3,690 MT = +1% YoY
- Mar: 3,624 MT = -6% YoY
- Apr: 3,946 MT = -3% YoY
- May: 4,917 MT = -4% YoY
- YTD (Jan–May): 21,140 MT = +4% YoY
- Thailand
- Jan: 2,392 MT = +21% YoY
- Feb: 2,129 MT = +66% YoY
- Mar: 2,240 MT = +48% YoY
- Apr: 2,233 MT = +10% YoY
- May: 1,521 MT = -18% YoY
- YTD (Jan–May): 10,515 MT = +22% YoY