Totals
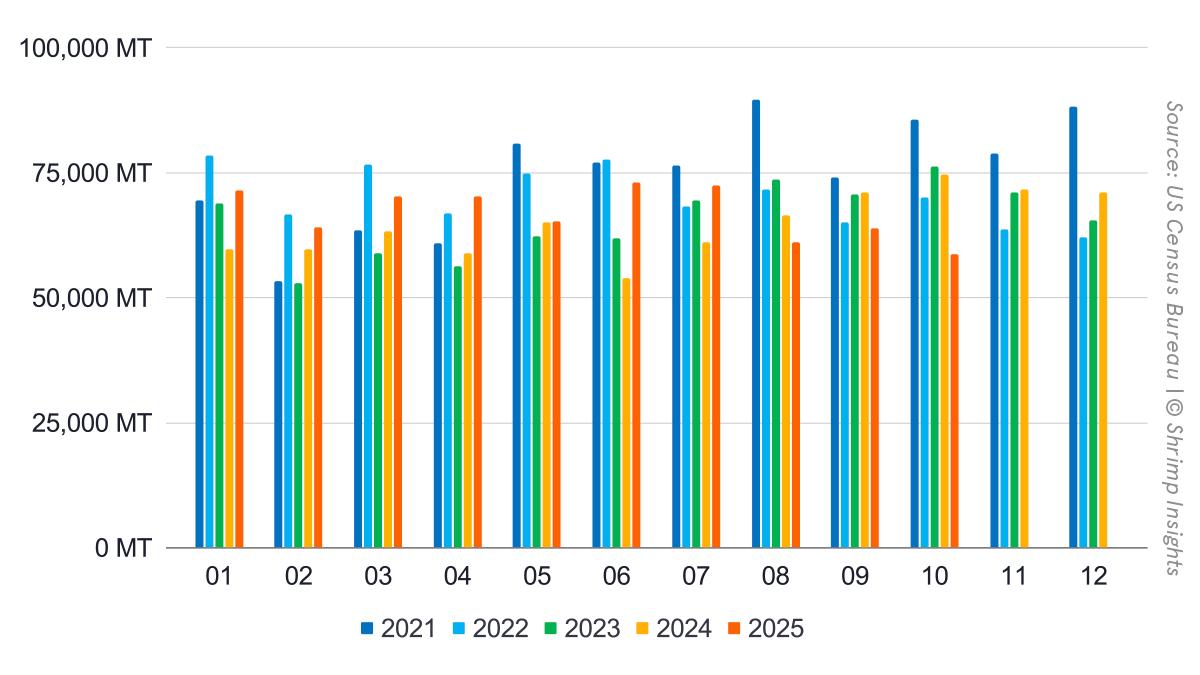
US shrimp imports weakened sharply in October, with volumes falling to 58,729 MT, down 21% year over year. This marked the third consecutive month of contraction and coincided with the implementation and anticipation of reciprocal U.S. tariffs on key supplying countries, which disrupted purchasing patterns and prompted importers to temporarily reduce exposure and draw down inventories. The slowdown follows an exceptionally strong first half of the year, suggesting that October represented not a demand collapse but a correction triggered by policy uncertainty and higher landed costs. Despite the weak autumn performance, imports into the United States still reached 670,695 MT year-to-date, 6% above last year. In value terms, October imports declined 17% year over year to USD 530 million, while cumulative value through October stood at USD 5.86 billion, up 13% year over year.
Products
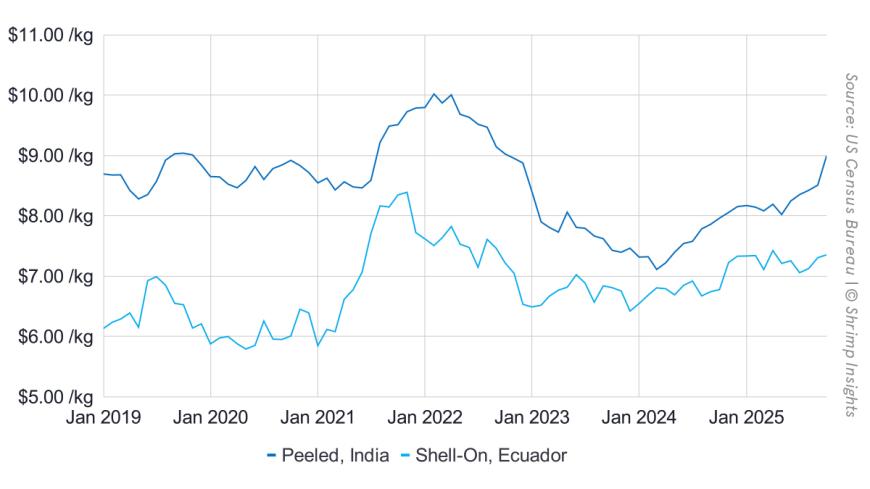
The impact of the October slowdown was broad-based but particularly visible in value-added products. Peeled frozen shrimp volumes fell 28% year over year to 26,649 MT, pulling year-to-date growth back to +9%. Cooked and marinated shrimp saw the sharpest decline, down 32% year over year in October, year-to-date still 10% ahead of last year. Breaded shrimp proved relatively resilient, declining 11% year over year in October and remaining slightly positive year to date. Shell-on frozen shrimp continued to lag structurally, with October volumes down 6% year over year and year-to-date imports 2% below last year.
Markets
Behind the headline contraction, October exposed a clear re-ordering among suppliers. Imports from India collapsed to 13,217 MT in October, down 57% year over year, making India the single largest contributor to the overall decline. This abrupt pullback reflects the high tariff exposure, as buyers adjusted sourcing strategies. In contrast, Ecuador continued to expand its footprint in the US market, with October imports rising 52% year over year to 22,016 MT. Ecuador’s growth highlights its relative insulation from recent trade disruptions and its increasing role as a stabilising supplier.
For Indonesia, the October decline was driven less by tariffs and more by non-tariff trade disruption. Indonesian shipments fell 34% year over year to 8,510 MT, reflecting the lingering impact of the radioactive Cesium-137 contamination issue, which triggered additional testing, certification requirements and temporary shipment delays earlier in the year. Although exports to the US have resumed under the new certification regime, October data show that volumes have not yet normalised. Imports from Vietnam also remained weak, down 26% year over year, while Thailand declined 27%, both reflecting ongoing competitiveness and cost challenges rather than acute policy shocks.
Overall, October marked a turning point for US shrimp imports. The combination of reciprocal tariffs, policy uncertainty, and supplier-specific disruptions shifted the market from aggressive buying to consolidation. While the year-to-date figures confirm that 2025 remains ahead of last year, October clearly demonstrated how quickly trade policy and non-tariff barriers can reshape supplier dynamics and monthly import flows.
Byte in Numbers
Totals
- Volume:
- Jan: 71,412 MT = +20% YoY
- Feb: 64,177 MT = +8% YoY
- Mar: 70,250 MT = +11% YoY
- Apr: 70,279 MT = +19% YoY
- May: 65,332 MT = +0% YoY
- Jun: 73,051 MT = +35% YoY
- Jul: 72,571 MT = +19% YoY
- Aug: 61,049 MT = -8% YoY
- Sep: 63,846 MT = -10% YoY
- Oct: 58,729 MT = -21% YoY
- YTD (Jan–Oct): 670,695 MT = +6% YoY
Value:
- Jan: USD 632 million = +33% YoY
- Feb: USD 555 million = +18% YoY
- Mar: USD 604 million = +21% YoY
- Apr: USD 612 million = +30% YoY
- May: USD 562 million = +9% YoY
- Jun: USD 643 million = +46% YoY
- Jul: USD 629 million = +25% YoY
- Aug: USD 531 million = -5% YoY
- Sep: USD 564 million = -6% YoY
- Oct: USD 530 million = -17% YoY
- YTD (Jan–Oct): USD 5,861 million = +13% YoY
Products
- Peeled Frozen
- Jan: 35,949 MT = +38% YoY
- Feb: 32,179 MT = +8% YoY
- Mar: 34,038 MT = +14% YoY
- Apr: 35,789 MT = +21% YoY
- May: 35,601 MT = +12% YoY
- Jun: 38,150 MT = +46% YoY
- Jul: 39,968 MT = +23% YoY
- Aug: 34,281 MT = -5% YoY
- Sep: 33,894 MT = -12% YoY
- Oct: 26,649 MT = -28% YoY
- YTD (Jan–Oct): 346,498 MT = +9% YoY
- Shell-On Frozen
- Jan: 18,068 MT = -9% YoY
- Feb: 16,797 MT = -3% YoY
- Mar: 20,477 MT = -4% YoY
- Apr: 17,988 MT = +12% YoY
- May: 15,971 MT = -15% YoY
- Jun: 17,175 MT = +18% YoY
- Jul: 16,770 MT = +19% YoY
- Aug: 13,275 MT = -16% YoY
- Sep: 15,116 MT = -5% YoY
- Oct: 17,432 MT = -6% YoY
- YTD (Jan–Oct): 169,068 MT = -2% YoY
- Cooked and Marinated
- Jan: 11,757 MT = +41% YoY
- Feb: 9,800 MT = +27% YoY
- Mar: 9,994 MT = +32% YoY
- Apr: 10,618 MT = +25% YoY
- May: 9,075 MT = +4% YoY
- Jun: 10,912 MT = +40% YoY
- Jul: 10,152 MT = +8% YoY
- Aug: 9,049 MT = -4% YoY
- Sep: 9,601 MT = -11% YoY
- Oct: 8,506 MT = -32% YoY
- YTD (Jan–Oct): 99,464 MT = +10% YoY
- Breaded
- Jan: 5,078 MT = +0% YoY
- Feb: 4,768 MT = +10% YoY
- Mar: 5,132 MT = +25% YoY
- Apr: 5,151 MT = +15% YoY
- May: 4,239 MT = -15% YoY
- Jun: 6,259 MT = +35% YoY
- Jul: 5,013 MT = +7% YoY
- Aug: 3,944 MT = -18% YoY
- Sep: 4,642 MT = -17% YoY
- Oct: 5,442 MT = -11% YoY
- YTD (Jan–Oct): 49,669 MT = +2% YoY
Top Five Origins
- India
- Jan: 31,165 MT = +55% YoY
- Feb: 24,655 MT = +4% YoY
- Mar: 24,952 MT = +7% YoY
- Apr: 26,670 MT = +25% YoY
- May: 26,005 MT = +15% YoY
- Jun: 28,820 MT = +44% YoY
- Jul: 30,890 MT = +15% YoY
- Aug: 26,709 MT = +1% YoY
- Sep: 26,628 MT = -10% YoY
- Oct: 13,217 MT = -57% YoY
- YTD (Jan–Oct): 259,711 MT = +6% YoY
- Ecuador
- Jan: 15,301 MT = -13% YoY
- Feb: 17,804 MT = +6% YoY
- Mar: 22,325 MT = +3% YoY
- Apr: 20,031 MT = +14% YoY
- May: 19,958 MT = +0% YoY
- Jun: 18,003 MT = +30% YoY
- Jul: 18,183 MT = +42% YoY
- Aug: 16,282 MT = +5% YoY
- Sep: 18,896 MT = +23% YoY
- Oct: 22,016 MT = +52% YoY
- YTD (Jan–Oct): 188,799 MT = +14% YoY
- Indonesia
- Jan: 11,534 MT = +2% YoY
- Feb: 10,469 MT = +4% YoY
- Mar: 12,563 MT = +32% YoY
- Apr: 13,925 MT = +34% YoY
- May: 9,249 MT = -21% YoY
- Jun: 13,219 MT = +42% YoY
- Jul: 12,704 MT = +24% YoY
- Aug: 8,600 MT = -21% YoY
- Sep: 7,505 MT = -31% YoY
- Oct: 8,510 MT = -34% YoY
- YTD (Jan–Oct): 108,278 MT = +1% YoY
- Vietnam
- Jan: 4,963 MT = +34% YoY
- Feb: 3,708 MT = +0% YoY
- Mar: 3,624 MT = -6% YoY
- Apr: 3,946 MT = -3% YoY
- May: 4,917 MT = -4% YoY
- Jun: 7,790 MT = +51% YoY
- Jul: 4,633 MT = -20% YoY
- Aug: 4,188 MT = -46% YoY
- Sep: 5,561 MT = -35% YoY
- Oct: 6,248 MT = -26% YoY
- YTD (Jan–Oct): 49,579 MT = -12% YoY
- Thailand
- Jan: 2,392 MT = +21% YoY
- Feb: 2,129 MT = +66% YoY
- Mar: 2,240 MT = +48% YoY
- Apr: 2,233 MT = +11% YoY
- May: 1,521 MT = -18% YoY
- Jun: 2,301 MT = +17% YoY
- Jul: 2,151 MT = -8% YoY
- Aug: 1,608 MT = -3% YoY
- Sep: 1,581 MT = -34% YoY
- Oct: 2,694 MT = -27% YoY
- YTD (Jan–Oct): 20,850 MT = +1% YoY