Totals
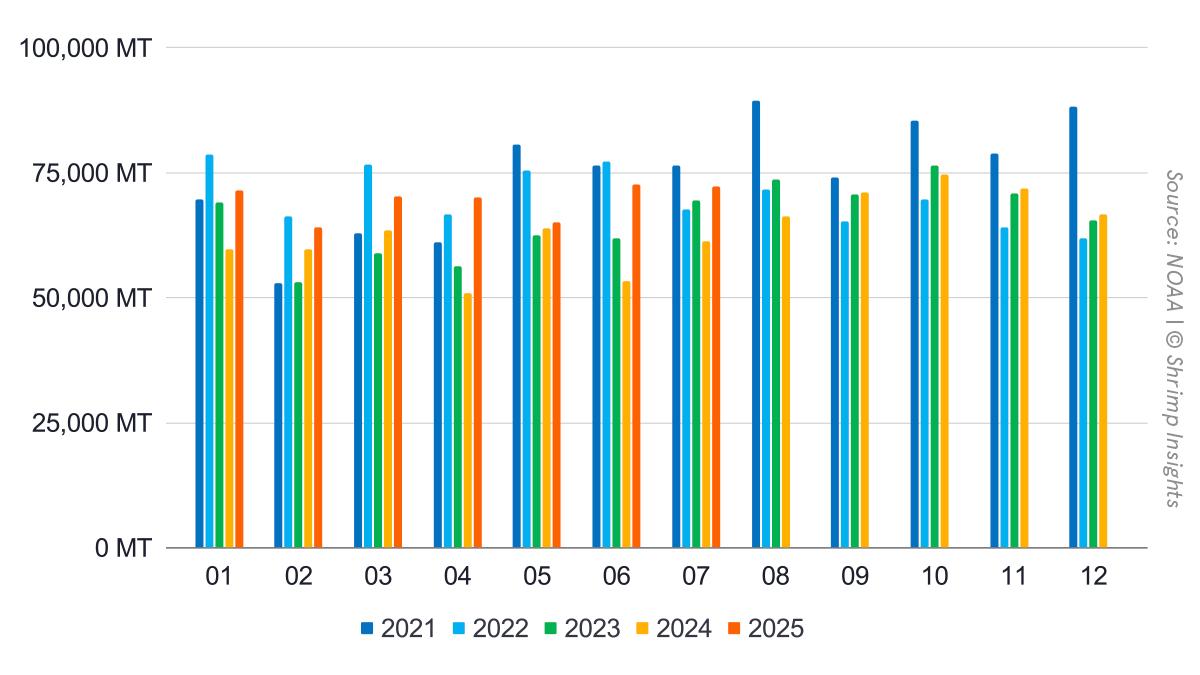
In July, US shrimp imports reached 72,352 MT, marking an 18% increase compared to the same month last year. Import value climbed even faster, up 24% year-on-year to $595 million. This sustained growth comes on top of a strong first half of 2025, keeping year-to-date imports at 486,069 MT, 18% higher than the same period last year, with value surging 27% to just over $4.0 billion. Month after month, the upward trend shows no signs of slowing, underlining the US market’s ongoing appetite for imported shrimp.
Suppliers
India and Ecuador remain the twin engines of supply to the US. India led in July with 30,717 MT, 15% above last year, while Ecuador posted an even stronger performance at 18,149 MT, up 41% year-on-year. Indonesia continued its steady climb, delivering 12,704 MT, a 23% rise compared to July 2024. Vietnam, however, saw a sharp 20% decline to 4,622 MT after strong gains in June, while Thailand slipped by 8% to 2,151 MT. Overall, the year-to-date picture shows India up 23% and Ecuador up 17%, reinforcing their leading positions in the US market.
Product Categories
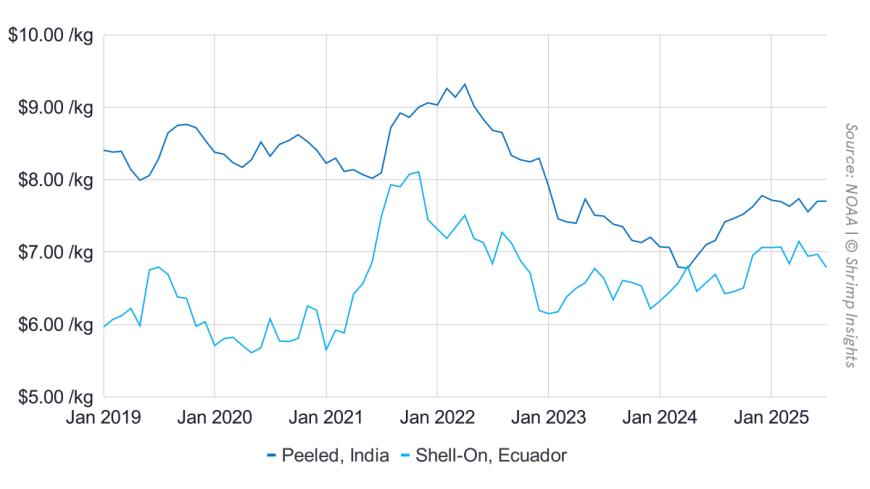
Peeled frozen shrimp continues to drive US demand, with July volumes hitting 39,838 MT, 22% higher than last year, and now accounting for more than half of total imports year-to-date. Shell-on frozen shrimp followed with 16,729 MT in July, showing a solid 19% gain year-on-year. Cooked and marinated shrimp, while smaller in share, still added 10,132 MT in July, 8% above last year. Breaded shrimp contributed 4,985 MT, a modest 7% increase.
Byte in Numbers
Totals
- Volume
- Jan: 71,412 MT = +20% YoY
- Feb: 64,145 MT = +8% YoY
- Mar: 70,214 MT = +11% YoY
- Apr: 70,141 MT = +38% YoY
- May: 65,044 MT = +2% YoY
- Jun: 72,763 MT = +36% YoY
- Jul: 72,352 MT = +18% YoY
- YTD (Jan–Jul): 486,069 MT = +18% YoY
- Value
- Jan: $604 million = +31% YoY
- Feb: $531 million = +16% YoY
- Mar: $577 million = +20% YoY
- Apr: $586 million = +47% YoY
- May: $538 million = +11% YoY
- Jun: $613 million = +47% YoY
- Jul: $595 million = +24% YoY
- YTD (Jan–Jul): $4,045 million = +27% YoY
Products
- Peeled Frozen
- Jan: 35,949 MT = +39% YoY
- Feb: 32,175 MT = +8% YoY
- Mar: 34,033 MT = +13% YoY
- Apr: 35,695 MT = +38% YoY
- May: 35,357 MT = +13% YoY
- Jun: 37,940 MT = +46% YoY
- Jul: 39,838 MT = +22% YoY
- YTD (Jan–Jul): 250,986 MT = +24% YoY
- Shell-On Frozen
- Jan: 18,068 MT = -9% YoY
- Feb: 16,793 MT = -3% YoY
- Mar: 20,452 MT = -4% YoY
- Apr: 17,988 MT = +52% YoY
- May: 15,960 MT = -12% YoY
- Jun: 17,127 MT = +20% YoY
- Jul: 16,729 MT = +19% YoY
- YTD (Jan–Jul): 123,118 MT = +5% YoY
- Cooked and Marinated
- Jan: 11,757 MT = +42% YoY
- Feb: 9,776 MT = +27% YoY
- Mar: 9,987 MT = +32% YoY
- Apr: 10,573 MT = +25% YoY
- May: 9,043 MT = +3% YoY
- Jun: 10,882 MT = +41% YoY
- Jul: 10,132 MT = +8% YoY
- YTD (Jan–Jul): 72,152 MT = +25% YoY
- Breaded
- Jan: 5,078 MT = +0% YoY
- Feb: 4,768 MT = +10% YoY
- Mar: 5,132 MT = +25% YoY
- Apr: 5,151 MT = +15% YoY
- May: 4,239 MT = -15% YoY
- Jun: 6,259 MT = +35% YoY
- Jul: 4,985 MT = +7% YoY
- YTD (Jan–Jul): 35,612 MT = +10% YoY
Top Five Origins
- India
- Jan: 31,165 MT = +55% YoY
- Feb: 24,641 MT = +4% YoY
- Mar: 24,937 MT = +7% YoY
- Apr: 26,611 MT = +26% YoY
- May: 25,903 MT = +16% YoY
- Jun: 28,577 MT = +44% YoY
- Jul: 30,717 MT = +15% YoY
- YTD (Jan–Jul): 192,552 MT = +23% YoY
- Ecuador
- Jan: 15,301 MT = -13% YoY
- Feb: 17,804 MT = +5% YoY
- Mar: 22,304 MT = +3% YoY
- Apr: 19,952 MT = +102% YoY
- May: 19,773 MT = +3% YoY
- Jun: 17,958 MT = +32% YoY
- Jul: 18,149 MT = +41% YoY
- YTD (Jan–Jul): 131,240 MT = +17% YoY
- Indonesia
- Jan: 11,534 MT = +1% YoY
- Feb: 10,469 MT = +5% YoY
- Mar: 12,563 MT = +32% YoY
- Apr: 13,925 MT = +34% YoY
- May: 9,249 MT = -21% YoY
- Jun: 13,219 MT = +44% YoY
- Jul: 12,704 MT = +23% YoY
- YTD (Jan–Jul): 83,663 MT = +15% YoY
- Vietnam
- Jan: 4,963 MT = +35% YoY
- Feb: 3,690 MT = +1% YoY
- Mar: 3,624 MT = -6% YoY
- Apr: 3,946 MT = -3% YoY
- May: 4,917 MT = -4% YoY
- Jun: 7,790 MT = +52% YoY
- Jul: 4,622 MT = -20% YoY
- YTD (Jan–Jul): 33,551 MT = +7% YoY
- Thailand
- Jan: 2,392 MT = +21% YoY
- Feb: 2,129 MT = +66% YoY
- Mar: 2,240 MT = +48% YoY
- Apr: 2,233 MT = +10% YoY
- May: 1,521 MT = -18% YoY
- Jun: 2,301 MT = +17% YoY
- Jul: 2,151 MT = -8% YoY
- YTD (Jan–Jul): 14,966 MT = +16% YoY