Totals
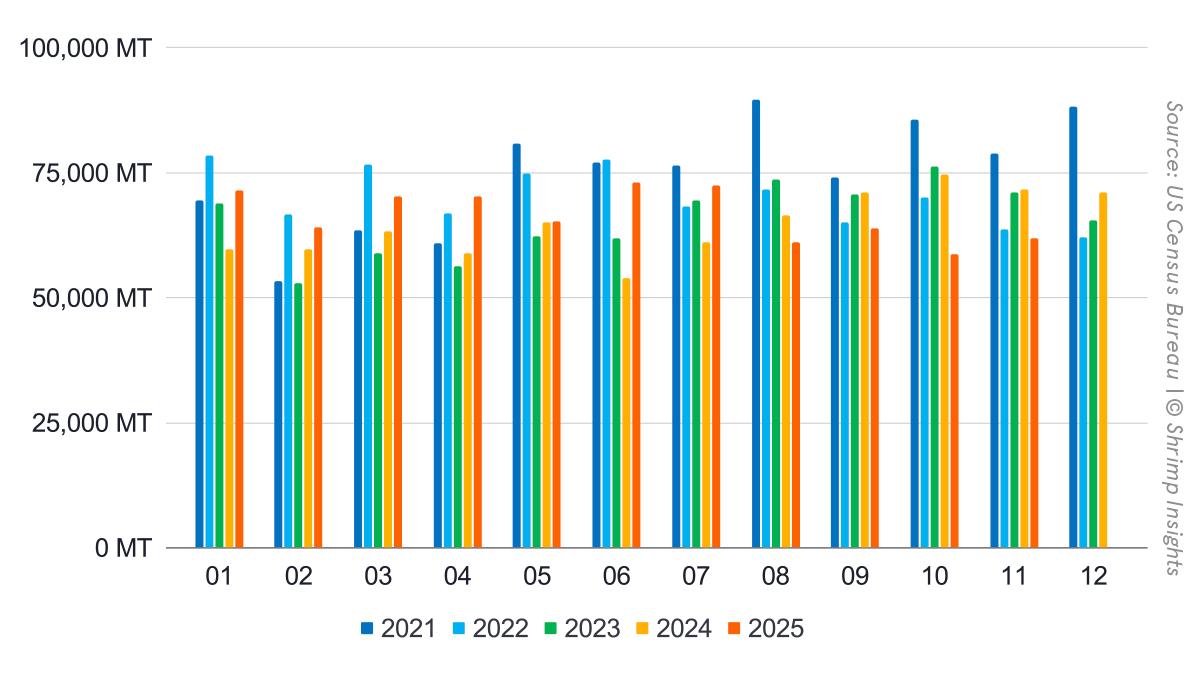
US shrimp imports showed solid growth in the first half of the year, with volumes expanding strongly through July, supported by ample supply and competitive pricing. From August onward, momentum weakened, with imports turning sharply lower in Q4 following the introduction of US reciprocal tariffs in October, which disrupted trade flows and reinforced inventory correction at importer level.
In November, imports totaled 61,688 MT, down 14% YoY, marking the fourth consecutive month of contraction. Import value declined more moderately to USD 582 million (-8% YoY), suggesting that part of the volume decline was offset by firmer prices and product mix effects amid higher landed costs following the tariff changes.
On a year-to-date basis (Jan–Nov), total import volume reached 729,546 MT, up 4% YoY, while import value increased more strongly to USD 6.44 billion (+11% YoY), underlining that growth was largely front-loaded into H1 and early Q3, prior to the tariff implementation.
Products
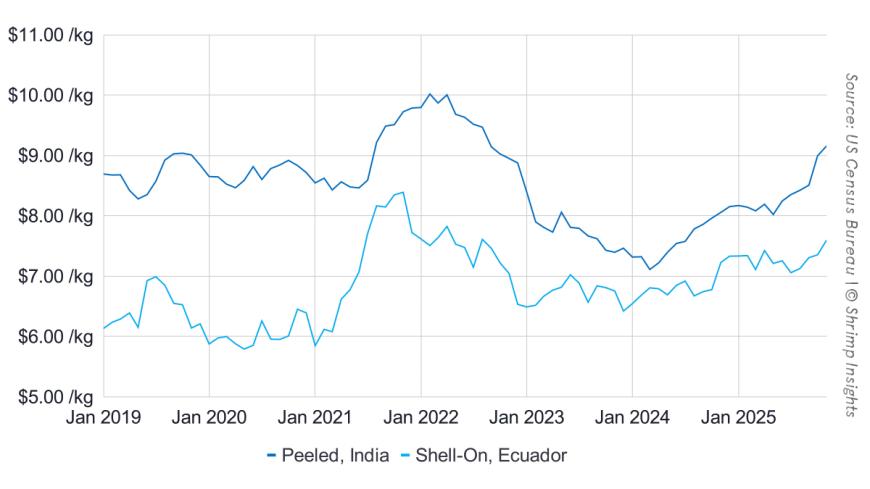
Peeled frozen shrimp remained the main growth driver in H1, posting strong double-digit growth through July, before demand weakened sharply in Q4 as reciprocal tariffs increased landed costs and buyers reduced forward purchasing. November volumes reached 30,293 MT, down 9% YoY, while year-to-date imports stood at 376,791 MT, up 7% YoY, reflecting strong pre-tariff buying earlier in the year.
Shell-on frozen shrimp showed a more subdued pattern throughout the year and proved particularly sensitive to the October tariff changes, given its thinner margins. November imports declined to 16,440 MT (-14% YoY), bringing YTD volumes to 185,508 MT, down 3% YoY.
Cooked and marinated products recorded strong growth in H1, supported by foodservice and retail demand, but saw a sharp slowdown in Q4 as higher landed prices reduced competitiveness. November volumes fell to 10,143 MT, down 24% YoY. Despite this late-year weakness, YTD imports reached 109,607 MT, still 5% higher YoY.
Breaded shrimp imports followed a similar pattern, with early-year gains offset by sustained declines from August onward. November volumes totaled 4,571 MT (-16% YoY), leaving YTD imports at 54,240 MT, effectively flat year-on-year.
Top Five Origins
India dominated US shrimp imports in the first half of the year, with very strong growth through July, before volumes dropped sharply from September onward following the implementation of reciprocal tariffs in October. November imports fell to 18,520 MT, down 32% YoY, after an even steeper decline in October. On a YTD basis, imports reached 278,231 MT, still 2% higher YoY, but with Q4 volumes significantly compressed.
Ecuador continued to gain market share throughout the year and was comparatively less affected by the tariff changes, supported by competitive pricing and strong demand. November imports surged to 20,884 MT, up 56% YoY, making Ecuador the strongest performer among major suppliers. YTD imports totaled 209,684 MT, up 17% YoY.
Indonesia posted solid growth in H1 but faced sustained pressure from mid-year onward, with reciprocal tariffs accelerating the downturn in Q4. November volumes dropped sharply to 7,412 MT, down 49% YoY, bringing YTD imports to 115,690 MT, down 5% YoY.
Vietnam’s performance remained volatile, with a mid-year recovery followed by renewed weakness in late summer. November imports rebounded to 8,010 MT, up 7% YoY, potentially reflecting delayed shipments clearing post-tariff uncertainty. Nevertheless, YTD imports stood at 57,589 MT, down 9% YoY.
Thailand’s exports remained structurally lower, with early-year growth insufficient to offset declines later in the year. November imports totaled 2,659 MT, down 38% YoY, and YTD imports reached 23,508 MT, down 6% YoY.
Byte in Numbers
Totals
- Volume:
- Jan: 71,412 MT = +20% YoY
- Feb: 64,177 MT = +8% YoY
- Mar: 70,250 MT = +11% YoY
- Apr: 70,279 MT = +19% YoY
- May: 65,332 MT = +0% YoY
- Jun: 73,051 MT = +35% YoY
- Jul: 72,571 MT = +19% YoY
- Aug: 61,049 MT = -8% YoY
- Sep: 63,846 MT = -10% YoY
- Oct: 58,729 MT = -21% YoY
- Nov: 61,688 MT = -14% YoY
- YTD (Jan–Nov): 729,546 MT = +4% YoY
Value:
- Jan: $632 million = +33% YoY
- Feb: $555 million = +18% YoY
- Mar: $604 million = +21% YoY
- Apr: $612 million = +30% YoY
- May: $562 million = +9% YoY
- Jun: $643 million = +46% YoY
- Jul: $629 million = +25% YoY
- Aug: $531 million = -5% YoY
- Sep: $564 million = -6% YoY
- Oct: $530 million = -17% YoY
- Nov: $582 million = -8% YoY
- YTD (Jan–Nov): $6,444 million = +11% YoY
Products
- Peeled Frozen
- Jan: 35,949 MT = +38% YoY
- Feb: 32,179 MT = +8% YoY
- Mar: 34,038 MT = +14% YoY
- Apr: 35,789 MT = +21% YoY
- May: 35,601 MT = +12% YoY
- Jun: 38,150 MT = +46% YoY
- Jul: 39,968 MT = +23% YoY
- Aug: 34,281 MT = -5% YoY
- Sep: 33,894 MT = -12% YoY
- Oct: 26,649 MT = -28% YoY
- Nov: 30,293 MT = -9% YoY
- YTD (Jan–Nov): 376,791 MT = +7% YoY
- Shell-On Frozen
- Jan: 18,068 MT = -9% YoY
- Feb: 16,797 MT = -3% YoY
- Mar: 20,477 MT = -4% YoY
- Apr: 17,988 MT = +12% YoY
- May: 15,971 MT = -15% YoY
- Jun: 17,175 MT = +18% YoY
- Jul: 16,770 MT = +19% YoY
- Aug: 13,275 MT = -16% YoY
- Sep: 15,116 MT = -5% YoY
- Oct: 17,432 MT = -6% YoY
- Nov: 16,440 MT = -14% YoY
- YTD (Jan–Nov): 185,508 MT = -3% YoY
- Cooked and Marinated
- Jan: 11,757 MT = +41% YoY
- Feb: 9,800 MT = +27% YoY
- Mar: 9,994 MT = +32% YoY
- Apr: 10,618 MT = +25% YoY
- May: 9,075 MT = +4% YoY
- Jun: 10,912 MT = +40% YoY
- Jul: 10,152 MT = +8% YoY
- Aug: 9,049 MT = -4% YoY
- Sep: 9,601 MT = -11% YoY
- Oct: 8,506 MT = -32% YoY
- Nov: 10,143 MT = -24% YoY
- YTD (Jan–Nov): 109,607 MT = +5% YoY
- Breaded
- Jan: 5,078 MT = +0% YoY
- Feb: 4,768 MT = +10% YoY
- Mar: 5,132 MT = +25% YoY
- Apr: 5,151 MT = +15% YoY
- May: 4,239 MT = -15% YoY
- Jun: 6,259 MT = +35% YoY
- Jul: 5,013 MT = +7% YoY
- Aug: 3,944 MT = -18% YoY
- Sep: 4,642 MT = -17% YoY
- Oct: 5,442 MT = -11% YoY
- Nov: 4,571 MT = -16% YoY
- YTD (Jan–Nov): 54,240 MT = -0% YoY
Top Five Origins
- India
- Jan: 31,165 MT = +55% YoY
- Feb: 24,655 MT = +4% YoY
- Mar: 24,952 MT = +7% YoY
- Apr: 26,670 MT = +25% YoY
- May: 26,005 MT = +15% YoY
- Jun: 28,820 MT = +44% YoY
- Jul: 30,890 MT = +15% YoY
- Aug: 26,709 MT = +1% YoY
- Sep: 26,628 MT = -10% YoY
- Oct: 13,217 MT = -57% YoY
- Nov: 18,520 MT = -32% YoY
- YTD (Jan–Nov): 278,231 MT = +2% YoY
- Ecuador
- Jan: 15,301 MT = -13% YoY
- Feb: 17,804 MT = +6% YoY
- Mar: 22,325 MT = +3% YoY
- Apr: 20,031 MT = +14% YoY
- May: 19,958 MT = +0% YoY
- Jun: 18,003 MT = +30% YoY
- Jul: 18,183 MT = +42% YoY
- Aug: 16,282 MT = +5% YoY
- Sep: 18,896 MT = +23% YoY
- Oct: 22,016 MT = +52% YoY
- Nov: 20,884 MT = +56% YoY
- YTD (Jan–Nov): 209,684 MT = +17% YoY
- Indonesia
- Jan: 11,534 MT = +2% YoY
- Feb: 10,469 MT = +4% YoY
- Mar: 12,563 MT = +32% YoY
- Apr: 13,925 MT = +34% YoY
- May: 9,249 MT = -21% YoY
- Jun: 13,219 MT = +42% YoY
- Jul: 12,704 MT = +24% YoY
- Aug: 8,600 MT = -21% YoY
- Sep: 7,505 MT = -31% YoY
- Oct: 8,510 MT = -34% YoY
- Nov: 7,412 MT = -49% YoY
- YTD (Jan–Nov): 115,690 MT = -5% YoY
- Vietnam
- Jan: 4,963 MT = +34% YoY
- Feb: 3,708 MT = +0% YoY
- Mar: 3,624 MT = -6% YoY
- Apr: 3,946 MT = -3% YoY
- May: 4,917 MT = -4% YoY
- Jun: 7,790 MT = +51% YoY
- Jul: 4,633 MT = -20% YoY
- Aug: 4,188 MT = -46% YoY
- Sep: 5,561 MT = -35% YoY
- Oct: 6,248 MT = -26% YoY
- Nov: 8,010 MT = +7% YoY
- YTD (Jan–Nov): 57,589 MT = -9% YoY
- Thailand
- Jan: 2,392 MT = +21% YoY
- Feb: 2,129 MT = +66% YoY
- Mar: 2,240 MT = +48% YoY
- Apr: 2,233 MT = +11% YoY
- May: 1,521 MT = -18% YoY
- Jun: 2,301 MT = +17% YoY
- Jul: 2,151 MT = -8% YoY
- Aug: 1,608 MT = -3% YoY
- Sep: 1,581 MT = -34% YoY
- Oct: 2,694 MT = -27% YoY
- Nov: 2,659 MT = -38% YoY
- YTD (Jan–Nov): 23,508 MT = -6% YoY